Abstract
Objectives: Inhalation of asbestos fibres is the predominant cause of malignant mesothelioma. Domestic exposure to asbestos is a major community concern in the Australian Capital Territory (ACT) because of loose-fill asbestos home insulation. Little is known about how trends in mesothelioma rates in the ACT compare with those elsewhere. The objective of this study was to describe trends in mesothelioma rates in the ACT and compare them with those for the rest of Australia.
Methods: We used de-identified data from the ACT Cancer Registry (1982–2014), and the Western Australia (WA) Cancer Registry and the Australian Cancer Database (1982–2011). We calculated crude mesothelioma rates, by 3-year periods, for the ACT and for the rest of Australia (excluding WA). We used Poisson regression to analyse mesothelioma trends from 1994 to 2011 (complete reporting period) using an indirect standardisation approach to adjust for age and sex.
Results: There were 140 mesothelioma cases reported to the ACT Cancer Registry between 1982 and 2014 – 81% male and 19% female. Between 1994 and 2011, age- and sex-adjusted mesothelioma rates in the ACT increased over time, on average by 12% per 3-year period (relative risk [RR] 1.12; 95% confidence interval [CI] 0.99, 1.26). Compared with the rest of Australia (excluding WA), ACT rates were, on average, lower (RR 0.84; 95% CI 0.69, 1.02), but they increased at a higher rate (RR 1.12 per 3-year period; 95% CI 0.99, 1.27). These results are strongly influenced by the higher rate of mesothelioma observed in the ACT in 2009–2011, when ACT rates became similar to those for the rest of Australia (excluding WA).
Conclusions: Although mesothelioma rates may have increased more in the ACT than the rest of Australia (excluding WA) during the past two decades, there is considerable uncertainty in the trends. More information is needed regarding the health risks associated with living in a house with loose-fill asbestos insulation. This is the subject of further studies within the ACT Asbestos Health Study.
Full text
Introduction
Inhalation of asbestos fibres is the predominant cause of malignant mesothelioma and an important contributor to the risk of lung, laryngeal and ovarian cancer in exposed people.1 Asbestos exposure can also cause nonmalignant lung conditions such as asbestosis and pleural plaques.2 The risk to health associated with asbestos exposure has been well documented in occupational settings3, whereas the health impact of asbestos in non-occupational settings is less clear.4
Domestic exposure to asbestos is a major concern in the Australian Capital Territory (ACT). Between 1968 and 1979, D. Jansen & Co. Pty Ltd and its successor firms – commonly and collectively referred to as ‘Mr Fluffy’ – insulated homes in the ACT and southern New South Wales by blowing crushed (loose-fill), mainly amosite, asbestos into roof spaces.5 Between 1989 and 1993, visual checks of some 65 000 houses in the ACT identified more than 1000 houses that contained this insulation. An extensive joint remediation program by the Australian and ACT governments removed loose-fill asbestos from the roof spaces and made efforts to prevent any residual asbestos from spreading inside the houses.5 It was recognised that the original program did not remove all loose-fill asbestos insulation. The issue re-emerged as a prominent community concern when, in 2012, asbestos fibres were found in living spaces of a house that was missed in the removal program and, subsequently, in some remediated houses.5 In response to this concern, the ACT Government established the Asbestos Response Taskforce, which has recommended that houses containing loose-fill asbestos be demolished under a buyback scheme.6 As of July 2015, there were 1022 affected properties registered with the Asbestos Response Taskforce.5
Although asbestos-based home insulation has been recognised as a health concern for ACT residents living in homes containing this material and for tradespeople who may have worked in the homes5, scientific data that quantify the health risks in this context are lacking. Mesothelioma incidence is often used as a marker of asbestos exposure that is sufficient to cause asbestos-related diseases, albeit a delayed marker because cases may not appear until 20–50 years after the initial asbestos exposure. Approximately 70–80% of pleural mesothelioma cases are associated with documented asbestos exposure.7–9 As of 2016, there have been no published epidemiological studies that compare trends in mesothelioma rates in the ACT with those elsewhere.
This study, which is part of the ACT Asbestos Health Study, aimed to describe trends in mesothelioma rates in the ACT from 1982 to 2014, and compare these rates with those for the rest of Australia, excluding Western Australia (WA). We excluded WA from the comparison because rates in WA are substantially higher than elsewhere in Australia because of the large number of cases associated with asbestos mining and milling at Wittenoom.10
Methods
Data
ACT Health supplied de-identified ACT Cancer Registry data for cases registered between January 1982 and December 2014. This population-based registry holds data back to 1982, although cancer reporting has been mandatory in the ACT only since 1994. All public and private pathology laboratories, hospitals and nursing homes in the ACT are required to notify diagnoses of cancer to the Cancer Registry.
The time from diagnosis of mesothelioma to registration is usually 3–5 months, sometimes longer; thus, some people who have been diagnosed with mesothelioma in the ACT before the end of 2014 may not have been registered at the time of data extraction for this report (30 April 2015). Data up to and including December 2011 are considered final. The main analysis included cases diagnosed between January 1994 and December 2011.
The registry records patients’ names, age, sex and address at the time of diagnosis, date of diagnosis, clinical and pathological details of the cancer, and date of death if relevant. Cancer type is coded to the International Classifications of Diseases for Oncology, third edition (ICD-O3); morphology (pathology) codes were used to identify mesothelioma cases for this study.
Mesothelioma data for the rest of Australia (aggregated by age, sex and year) were sourced from the Australian Cancer Database.11 These aggregate data were available for January 1982 to December 2011, with approximately one-third of the total cases in 2010 and 2011 estimated because the 2010 and 2011 incidence data for New South Wales and the ACT were not available at the time of data extraction.11 To exclude WA cases, we used WA mesothelioma data, aggregated by age, sex and year (1982 to 2011), from the WA Cancer Registry, Government of Western Australia, Department of Health. To calculate rates, we obtained population counts by age, sex and year from the Australian Bureau of Statistics.12,13
Analysis
For both the ACT and the rest of Australia, we calculated the number of mesothelioma cases and the total person-years of observation by sex, age group (based on age at diagnosis, categorised as <25, 25–34, 35–44, 45–54, 55–64, 65–74, 75–84 and ≥85 years) and period (based on year of diagnosis, grouped into 3-year periods from 1982–84 to 2012–2014). We calculated the crude mesothelioma incidence rate per 100 000 person-years with exact 95% confidence intervals (CIs) by period.
We performed a series of Poisson regression analyses to model mesothelioma trends from January 1994 to December 2011, the period for which data are considered complete. We used an indirect standardisation approach to adjust for age and sex because of the small number of cases. To calculate the expected cases in the ACT for each year, we used the age- and sex-specific rates for Australia (excluding WA and the ACT) in 2000–2002 as the standard (Models 1 and 2). We used the age- and sex-specific rates for Australia (excluding WA and the ACT) in each specific period as the standard when comparing mesothelioma rates in the ACT with those for the rest of Australia (Models 3–5). In the analyses, we regressed observed cases on the factors of interest (sex, period) using a log link, with the log of expected cases as an offset. Period was modelled as a continuous and a categorical variable in separate models, with the Wald test used to assess the significance of period in the latter. All models were tested for goodness of fit using the Pearson chi-square test. Model coefficients were exponentiated, with estimates reported as relative risks (RRs) (point estimates with 95% CIs). All analyses were performed using Stata version 14 (StataCorp).
The ACT Health Human Research Ethics Committee (ETH.11.14.330,) and the Australian National University Human Research Ethics Committee (Protocol no. 2014/808) approved the project.
Results
There were 140 mesothelioma cases reported to the ACT Cancer Registry between January 1982 and December 2014; 81% were male (n = 113) and 19% were female (n = 27). Of these, 73% (n = 102; males n = 88, 86%) were diagnosed between January 1994 and December 2011, the main study period (Appendix 1, available from: hdl.handle.net/1885/107277). Of all registered cases, 35% (n = 49) were diagnosed at age 65–74 years, 24% (n = 33) in those aged 55–64 years, and less than 5% (n = 6) in people younger than 45. Although recorded crude mesothelioma rates generally increased between 1982 and 2011, rates in the ACT were generally lower than in the rest of Australia; however, they were similar in 2009–2011, being 2.95 (95% CI 2.02, 4.17) and 2.94 (95% CI 2.80, 3.08) per 100 000 person-years in the ACT and the rest of Australia (excluding WA), respectively (Figure 1).
Figure 1. Crude rates of mesothelioma in the ACT and the rest of Australia (excluding WA), by period, both sexes, 1982 to 2014
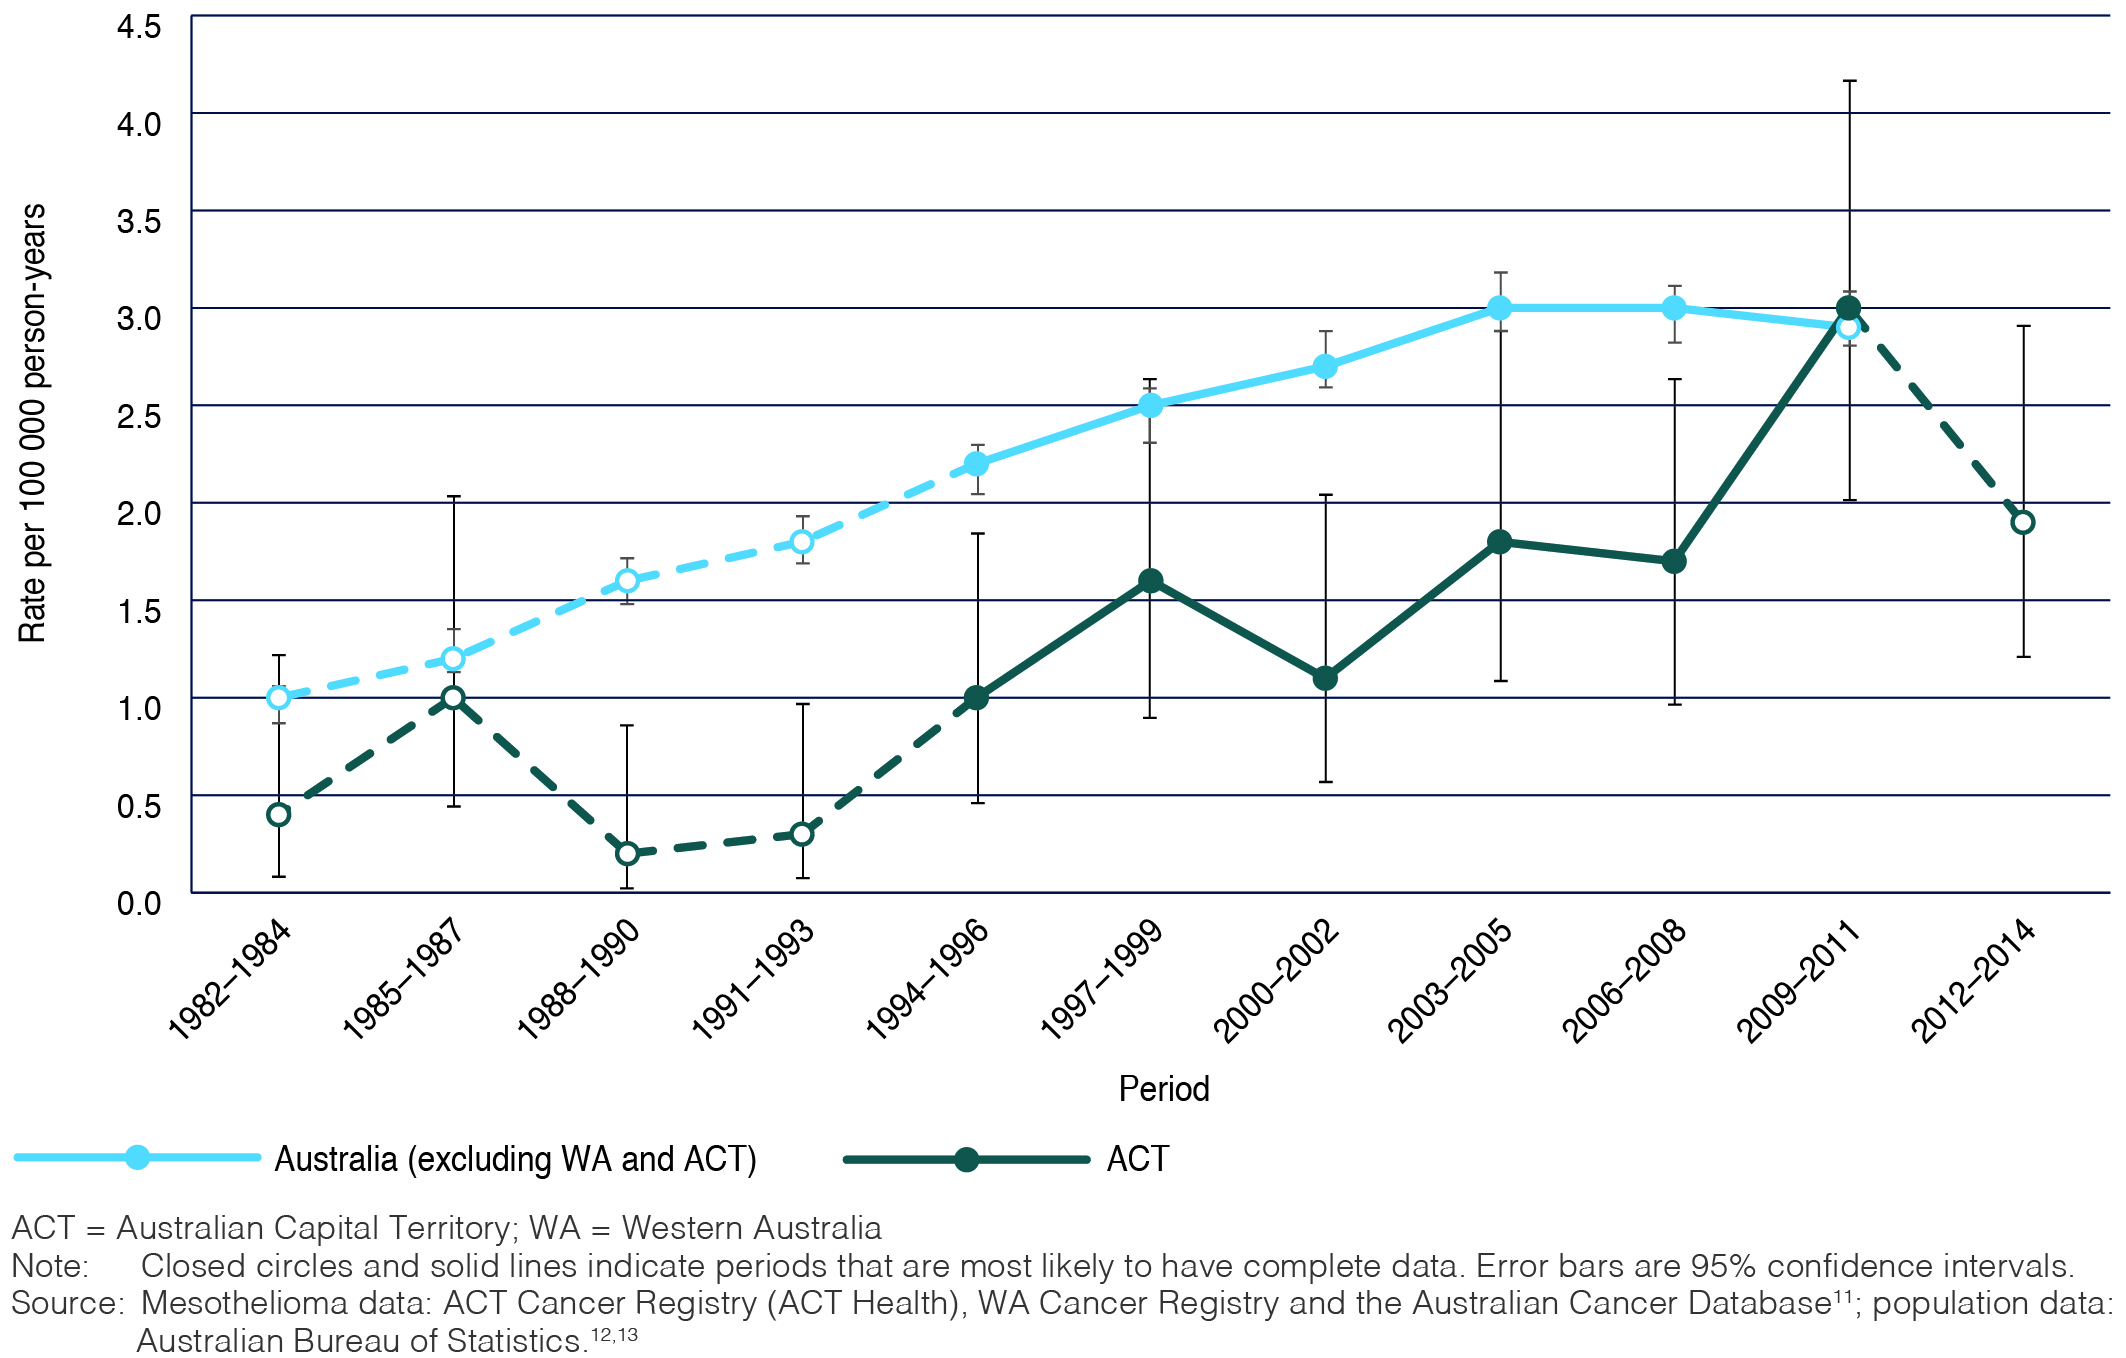
Between 1994 and 2011, age-adjusted mesothelioma rates in the ACT were 6.29 times (95% CI 3.58, 11.05) higher in males than females (Model 1, Table 1). Age- and sex-adjusted ACT rates increased over time, on average by 12% per 3-year period (Model 1: RR 1.12; 95% CI 0.99, 1.26). When period was modelled as a categorical variable (Model 2), there was no consistent evidence that adjusted mesothelioma incidence increased with time between 1994 and 2008. The incidence in 2009–2011, however, was appreciably higher than in all preceding periods. If data for 2009–2011 are excluded from Model 1, the RR for period falls to 1.02 (95% CI 0.86, 1.21), indicating a strong dependence of the RR of 1.12 on the higher rate of mesothelioma observed in 2009–2011. Although this might indicate a recent increase in mesothelioma rates in the ACT, substantial period-by-period fluctuations in mesothelioma incidence in the ACT have been common since 1982 (Table 1 and Figure 1).
Age- and sex-adjusted mesothelioma rates were lower, on average, in the ACT than in the rest of Australia (excluding WA) between 1994 and 2011 (Table 2, Model 3: RR 0.84; 95% CI 0.69, 1.02). Incidence increased at a 12% higher rate per 3-year period in the ACT than in Australia (Table 2, Model 4: RR 1.12; 95% CI 0.99, 1.27); however, if data from 2009–2011 are excluded from the analyses, ACT rates do not increase faster than the rest of Australia (RR 1.00; 95% CI 0.84, 1.19).
Table 1. Poisson regression model results for mesothelioma incidence, comparisons within the Australian Capital Territory, 1994 to 2011
| Model | Variable | Relative risk | 95% confidence interval |
| Model 1 | Period | 1.12 | 0.99, 1.26 |
| Females | 1.00 | – | |
| Males | 6.29 | 3.58, 11.05 | |
| Model 2 | 1994–1996 | 1.07 | 0.44, 2.58 |
| 1997–1999 | 1.56 | 0.72, 3.39 | |
| 2000–2002 | 1.00 | – | |
| 2003–2005 | 1.47 | 0.70, 3.12 | |
| 2006–2008 | 1.26 | 0.59, 2.69 | |
| 2009–2011 | 2.17 | 1.09, 4.30 | |
| (p value for Wald test) | (1.07) | – |
– = not applicable
Notes:
1. The relative risk is adjusted for age and sex (where appropriate) using the indirect method.
2. In Models 1 and 2, the expected cases are calculated using the age- and sex-specific rates for Australia (excluding Western Australia and the Australian Capital Territory) in 2000–2002 as the standard.
Table 2. Poisson regression model results for mesothelioma incidence, comparisons with the rest of Australia, excluding Western Australia, 1994 to 2011
| Model | Variable | Relative risk | 95% confidence interval |
| Model 3 | ACT (constant) | 0.84 | 0.69, 1.02 |
| Model 4 | Period | 1.12 | 0.99, 1.27 |
| Model 5 | 1994–1996 | 1.18 | 0.49, 2.84 |
| 1997–1999 | 1.62 | 0.74, 3.52 | |
| 2000–2002 | 1.00 | – | |
| 2003–2005 | 1.42 | 0.67, 3.00 | |
| 2006–2008 | 1.29 | 0.60, 2.75 | |
| 2009–2011 | 2.32 | 1.17, 4.59 | |
| (p value for Wald test) | (0.122) | – |
– = not applicable; ACT = Australian Capital Territory
Notes:
1. The relative risk is adjusted for age and sex (where appropriate) using the indirect method.
2. In Models 3–5, the expected cases are calculated using the age- and sex-specific rates for Australia (excluding Western Australia and the Australian Capital Territory) in each period as the standard.
Discussion
Rates of mesothelioma have increased over time in the ACT, but remain low. Taking into account demographic changes in the ACT, rates increased 12% more in the ACT than the rest of Australia (excluding WA) between 1994 and 2011. However, there is considerable uncertainty around this estimate. Moreover, the greater increase in the ACT than in the rest of Australia appeared to be confined to 2009–2011, when ACT rates became similar to those in the rest of Australia. Although there was an apparent decrease in rates in the most recent period (2012–2014), it is not possible to reach a conclusion on this point because ACT cancer data are unlikely to be complete for this period.
That the incidence of mesothelioma rose over time in the ACT, at least up to 2009–2011, is generally consistent with national and international trends.8,9,14,15 Most countries have now banned asbestos products; in Australia, the manufacture of asbestos products ceased in 1987, and the sale, use and manufacture of asbestos products have been banned since 2003.10 The trends in mesothelioma incidence generally reflect the widespread use of asbestos since the 1940s and the long lag time (20–50 years) expected between exposure and the development of mesothelioma.14,16 Given this lag, it will be important to continue monitoring mesothelioma rates in the ACT.
We were unable to model trends in males and females separately because of the small number of female cases. However, that overall rates of mesothelioma were substantially higher in men than women is consistent with national and international data.9–11 Although we cannot ascertain the reason for higher rates in men from this study, as elsewhere, it probably reflects the higher occupational exposure to asbestos among men, which is the predominant exposure type among those diagnosed with mesothelioma.10
Beyond comparisons with other studies, we are unable to explain the trends in mesothelioma rates in the ACT from this study. Exposure to domestic loose-fill asbestos insulation is one possible explanation, along with occupational and other non-occupational exposures. Statistical artefact (because of change over time in the accuracy of medical diagnosis of mesothelioma and ascertainment of cases), as well as changes in the population structure (apart from age and sex), cannot be ruled out.
There are several limitations that need to be borne in mind when interpreting the results of this study. Because of the small number of cases, there is considerable statistical uncertainty in the results. The modelling procedure used to test trends over time in the ACT relied on assumptions of proportional rate ratios17; although this may be a reasonable assumption to make, there was insufficient power to test it. There also may be some bias in ascertainment of cases – the ACT Cancer Registry does not include people with unconfirmed mesothelioma, nor cases in former ACT residents who lived interstate at the time of their diagnosis. The registry also may include people who only recently moved to the ACT. Similar issues also apply to the data for the rest of Australia. In addition, the aggregate data sourced from the Australian Cancer Database for the years 2010 and 2011 included both estimated and actual cases.
Conclusion
Although it is possible that mesothelioma rates have increased more in the ACT than the rest of Australia (excluding WA), there is considerable associated uncertainty, and the apparent increase was largely the result of the increase in the 2009–2011 period. The reason for this apparent trend is not known, and exposure to domestic asbestos, including loose-fill asbestos insulation, is one of several possible explanations. Specific information is needed about the health risks associated with living in a house with loose-fill asbestos insulation, which is the subject of further studies within the ACT Asbestos Health Study.
Acknowledgements
The ACT Government provided funding for this study under the ACT Asbestos Health Study. We thank the ACT Asbestos Health Study Steering Committee and Dr Hai Phung for their feedback on the study.
Copyright:

© 2016 Korda et al. This article is licensed under the Creative Commons Attribution-NonCommercial-ShareAlike 4.0 International Licence, which allows others to redistribute, adapt and share this work non-commercially provided they attribute the work and any adapted version of it is distributed under the same Creative Commons licence terms.
References
- 1. Straif K, Benbrahim-Tallaa L, Baan R, Grosse Y, Secretan B, El Ghissassi F, et al. A review of human carcinogens--Part C: metals, arsenic, dusts, and fibres. Lancet Oncol. 2009;10(5):453–4. CrossRef | PubMed
- 2. Wolff H, Vehmas T, Oksa P, Rantanen J, Vainio H. Asbestos, asbestosis, and cancer, the Helsinki criteria for diagnosis and attribution 2014: recommendations. Scand J Work Environ Health. 2015;41(1):5–15. CrossRef | PubMed
- 3. Rake C, Gilham C, Hatch J, Darnton A, Hodgson J, Peto J. Occupational, domestic and environmental mesothelioma risks in the British population: a case-control study. Br J Cancer. 2009;100(7):1175–83. CrossRef | PubMed
- 4. Goswami E, Craven V, Dahlstrom DL, Alexander D, Mowat F. Domestic asbestos exposure: a review of epidemiologic and exposure data. Int J Environ Res Public Health. 2013;10(11):5629–70. CrossRef | PubMed
- 5. ACT Government Asbestos Response Taskforce. Long term management of loose fill asbestos insulation in Canberra homes. Canberra: Asbestos Response Taskforce; 2014 [cited 2016 Jun 22]. Available from: www.asbestostaskforce.act.gov.au/__data/assets/pdf_file/0009/675189/Longterm-management-review.pdf
- 6. ACT Government Asbestos Response Taskforce. Buyback and support. Canberra: Asbestos Response Taskforce; 2016 [cited 2016 Jun 28]. Available from: www.asbestostaskforce.act.gov.au/voluntary-buyback-and-support
- 7. Sterman D, Litzky L, Kaiser L, Albelda S. Epidemiology of malignant pleural mesothelioma. UpToDate. 2016 [cited 2016 Aug 11]. Available from: www.uptodate.com/contents/epidemiology-of-malignant-pleural-mesothelioma
- 8. Stayner L, Welch LS, Lemen R. The worldwide pandemic of asbestos-related diseases. Annu Rev Public Health. 2013;34:205–16. CrossRef | PubMed
- 9. Robinson BM. Malignant pleural mesothelioma: an epidemiological perspective. Ann Cardiothorac Surg. 2012;1(4):491–6. PubMed
- 10. Safe Work Australia. Australian Mesothelioma Registry 3rd data report. Mesothelioma in Australia 2013. Canberra: Safe Work Australia; 2015 [cited 2016 Aug 11]. Available from: www.safeworkaustralia.gov.au/sites/swa/news/pages/tn260814
- 11. Australian Institute of Health and Welfare. Australian cancer incidence and mortality (ACIM) books. Mesothelioma. Canberra: AIHW; 2016 [cited 2016 Aug 11]. Available from: www.aihw.gov.au/WorkArea//DownloadAsset.aspx?id=60129554492
- 12. Australian Bureau of Statistics. 3101.0 – Australian demographic statistics, Sep 2014. Canberra: ABS; 2015 [cited 2016 Aug 11]. Available from: www.abs.gov.au/AUSSTATS/[email protected]/Lookup/3101.0Main+Features1Sep%202014
- 13. Australian Bureau of Statistics. 3105.0.65.001 – Australian historical population statistics. Cat no.. Canberra: ABS; 2015 [cited 2016 Aug 11]. Available from: www.abs.gov.au/ausstats/[email protected]/mf/3105.0.65.001
- 14. Clements M, Berry G, Shi J, Ware S, Yates D, Johnson A. Projected mesothelioma incidence in men in New South Wales. Occup Environ Med. 2007;64(11):747–52. CrossRef | PubMed
- 15. Australian Institute of Health and Welfare. Cancer in Australia: an overview 2014. Canberra: AIHW; 2015 [cited 2016 Jun 28]. Available from: www.aihw.gov.au/WorkArea/DownloadAsset.aspx?id=60129550202
- 16. Environmental Health Standing Committee (enHealth). Management of asbestos in the non-occupational environment. Report prepared for the Department of Health and Ageing by Monash University. Canberra: enHealth; 2005 [cited 2016 Aug 12]. Available from: content.webarchive.nla.gov.au/gov/wayback/20080727052532/https://www.health.gov.au/internet/main/publishing.nsf/Content/FB262D7C35664103CA257420001F2D74/$File/asbestos.pdf
- 17. Armstrong BG. Comparing standardized mortality ratios. Ann Epidemiol. 1995 Jan;5(1):60–4. CrossRef | PubMed