Abstract
Background: Low birthweight (<2500 g) is often used as a population-level indicator of maternal-child health, as it is easy to measure and correlates with poorer infant health outcomes. However, it conflates preterm birth and intrauterine growth restriction, which have different causal pathways and require different approaches to prevention. Small for gestational age (SGA) (a proxy for growth restriction) and preterm birth may be more informative measures. We evaluated low birthweight as a population-level indicator.
Methods: We conducted a population-based cohort study of singleton live births in New South Wales (NSW), Australia, using linked data from 1994–2006 birth, hospital, death and educational records, with follow-up until 2014. Outcomes of babies born of low birthweight, preterm and SGA were compared with well-grown term infants (i.e. not low birthweight or SGA). Overlap between groups and temporal trends were also examined.
Results: Of 1 093 765 singleton live births, 47 946 (4.4%) infants were low birthweight and had poorer outcomes than well-grown term infants (2.7% vs. 0.1% infant mortality; 13% vs. 6% below national minimum numeracy standard). SGA and preterm infants also had poorer outcomes (0.5%, 2.3% infant mortality respectively; 10%, 11% below numeracy standard) but 80% of SGA and 47% of preterm infants were not low birthweight. For all outcomes, low birthweight identified a smaller proportion of infants with poor outcomes than preterm birth and than either SGA or low birthweight at term. The proportion of low-birthweight births remained constant over time, while the proportion of births that were preterm increased and proportion of SGA decreased.
Conclusions: Low birthweight, SGA and preterm infants are all at higher risk of poorer outcomes but low birthweight inadequately captures, and masks trends in, both preterm births and births that are SGA. Reporting preterm births and an indicator of growth restriction at term will identify vulnerable groups better than using the measure of low birthweight.
Full text
Introduction
Low birthweight (<2500 g) is used as a summary indicator of maternal and infant health for comparing populations or measuring trends over time.1 The 2500 g cut-off was initially used to identify preterm infants for a study published in 1918, when gestational age could rarely be reliably determined.2 However, low birthweight may be due to preterm birth, intrauterine growth restriction (IUGR), or both.
Although preterm birth and IUGR are both associated with poorer infant and childhood outcomes3,4, the causal pathways are different, and require different approaches to prevention.5 By conflating preterm birth and IUGR, the use of low birthweight as a population-level indicator may inadequately inform public health action, and opposing trends in the two conditions may be masked. This occurred in Canada between 1995 and 2004, when the proportion of low-birthweight live births remained stable while there was a simultaneous substantial increase in preterm birth and decrease in IUGR.6
However, reporting on preterm birth and IUGR requires an accurate measure of gestational age: preterm is defined by gestational age, and IUGR is difficult to diagnose, so small for gestational age (SGA), a birthweight below the 10th percentile for gestational age and sex, is typically used as a proxy.7 In low-resource settings, gestational age may not be accurately determined or collected, so low birthweight may be an appropriate compromise measure. However, in countries like Australia where gestational age is routinely recorded in perinatal data, replacing the single low-birthweight indicator with indicators for preterm birth and IUGR may provide more useful information.
The aim of this study was to evaluate low birthweight as a population-level indicator of infant and child health. Using population data from New South Wales (NSW), the most populous state in Australia, we identified groups defined by low birthweight, preterm birth and SGA. For each of these groups, we examined: 1) the overlap between the groups, 2) trends over the study period and 3) child health and educational outcomes. We also examined alternative combinations of indicators that might be more useful for making comparisons between populations, and for informing and monitoring population health interventions.
Methods
Study design and population
This was a population-based record-linkage cohort study of singleton live births in NSW with a gestational age of 24 weeks or more, between 1994 and 2006, with follow-up until 2014.
Data sources
Birth information was obtained from the NSW Perinatal Data Collection, a population-based statutory data collection encompassing all live births and stillbirths of at least 20 weeks gestation or 400 g birthweight. Birth cohorts from 1994 to 2006 were included.
Hospital records for years 2001–2013 were obtained from the NSW Admitted Patient Data Collection, which includes records of all hospitalisations from all public and private hospitals in NSW. Hospital records include information about the length of stay, diagnoses and procedures related to the admission, coded using the International Statistical Classification of Diseases and Related Health Problems, Australian Modification (ICD-10-AM) and the Australian Classification of Health Interventions.
Information about deaths during infancy and childhood were obtained from the NSW Registry of Births, Deaths and Marriages death registration data, which includes all deaths registered in NSW. Data were available for deaths registered between January 1994 and March 2014.
Educational information was obtained from the National Assessment Program – Literacy and Numeracy (NAPLAN) annual assessment of students in Australian schools in grades 3, 5, 7 and 9.8 Children’s skills in numeracy, reading, writing and language conventions (spelling, grammar and punctuation) are assessed. For each test, scores are nationally equated across grades and years to ensure that results are comparable between grades and over time. Children are then categorised into one of six achievement bands based on their equated scores and nationally defined cut-off points for each grade. Data were available from 2009 to 2014 for students enrolled in government schools.
Birth, hospital, death and education data were probabilistically linked by the NSW Centre for Health Record Linkage, and anonymised data were provided to the researchers. False-positive and false-negative linkage results are each less than 5 in 1000.9 The methods used provide high, representative linkage rates for infants born alive after 24 weeks.10 Linkage rates for educational data are consistent across the gestational age range for children who live to school age.11
The study was approved by the NSW Population and Health Services Research Ethics Committee (#2012-12-430).
Indicators
To differentiate between the two main contributors to low birthweight, the primary indicators of interest were preterm birth and SGA (as a proxy for intrauterine growth restriction). They were defined using the birthweight and gestational age recorded for each live born infant in the NSW Perinatal Data Collection. Birthweight and gestational age have been demonstrated to be reliably reported when compared to medical records.12 Gestational age is reported in completed weeks of gestation, as determined by the best clinical estimate including early ultrasound and last menstrual period.13 Low birthweight was defined as birthweight less than 2500 g, preterm birth was defined as any birth that occurred at a gestational age of less than 37 completed weeks, and SGA was defined as a birthweight less than the 10th percentile for gestational age and sex, using Australian birthweight percentiles.14 Two further potential indicators that excluded the effect of preterm birth were defined: low birthweight at term and SGA at term. The comparison group for all indicators comprised infants who were born at term with a birthweight of ≥2500 g and who were above the 10th birthweight percentile (i.e. not SGA), referred to hereafter as well-grown term infants.
Outcomes
Two all-cause mortality outcomes were examined: death in the first year of life (infant mortality), and death in the first 5 years of life (child mortality).
The number of hospitalisations from 7 days after the last day of the birth admission to 1 year and to 5 years of age were calculated for each infant. Admissions within 7 days of the birth admission were excluded to better capture infant and child morbidity, by removing admissions relating to the immediate effects of birth such as neonatal jaundice and feeding problems. The number of hospitalisations was categorised as 0, 1, and 2 or more.
The educational outcomes of interest were performance below the NAPLAN national minimum standard in reading or numeracy. Children who perform below the national minimum standard are those in the bottom band for their grade or who were exempt from sitting the test due to significant or complex disability.15 Reading and numeracy are the components of NAPLAN assessment that remain the most consistent over time. Where a child’s results were available from multiple years, the first available result was used. All children for whom at least one linked NAPLAN result was available were included.
Infants with severe congenital conditions were excluded from the calculation of all outcomes.
Analysis
Records of live singleton births from 24 weeks gestation onwards were selected. Records with missing data for baby’s sex or birthweight were excluded (n = 1284, 0.1%). Records with implausible birthweights recorded were removed (n = 1479, 0.1%), based on the Tukey method, using a cut-off of 2.5 times the interquartile range.16 The overlap between groups defined by the primary indicators was assessed using a contingency table. The proportion of live births that were low birthweight, SGA or born preterm was plotted by year of birth to assess trends. The proportion of infants with each of the specified outcomes in each of the groups of interest was calculated. The denominator for each proportion was the number of infants in that group for whom data were available. This denominator was not the same for all outcomes, as the years for which data were available varied.
To more accurately describe both preterm birth and IUGR at a population level, two pairs of indicators were proposed: preterm birth plus low birthweight at term, and preterm birth plus SGA at term. For each of the three groups – low birthweight, and the two groups defined by the pairs of proposed indicators – the proportion of children with each of the outcomes of interest was calculated.
Analysis was performed using SAS Enterprise Guide (Cary, NC: SAS Institute; v6.1).
Results
The study population comprised 1 093 765 singleton live births of ≥24 weeks gestation between 1994 and 2006. Of these, 47 942 (4.4%) were low birthweight, 117 656 (10.8%) were SGA, and 56 441 (5.2%) were born preterm. In total, there were 169 012 infants (15.5%) who were low birthweight, SGA or preterm or a combination of those indicators.
The low-birthweight group was heterogeneous, including a mixture of preterm and term births, and SGA and not-SGA infants (Table 1). Of the 47 942 low-birthweight infants, 29 748 (62%) were preterm, 23 279 (49%) were SGA, and 765 (1.6%) were born not-SGA at term. Almost half of the 56 441 preterm infants (n = 26 693, 47%) and the majority of SGA infants (80%) weighed 2500 g or more at birth. Of the 169 012 infants who were either low birthweight, SGA or preterm, the majority (n = 121 070, 72%) were not low birthweight, hence using low birthweight as an indicator would only detect 28% of these infants.
Table 1. Number and percentage of infants classified by birthweight, size for age and gestational age at birth (N = 1 093 765)
| n (% of total live births) | |||
| Low birthweight (<2500 g) | Not low birthweight (≥2500 g) | Total | |
| 47 942 (4.4) | 1 045 823 (95.6) | 1 096 765 | |
| Term (≥37 weeks) | |||
| Not SGA | 765 (0.1) | 924 753 (84.3) | 925 518 (84.4) |
| SGA | 17 429 (1.6) | 94 377 (8.6) | 111 806 (10.2) |
| Preterm (<37 weeks) | |||
| Not SGA | 23 898 (2.2) | 26 693 (2.4) | 50 591 (4.6) |
| SGA | 5 850 (0.5) | 0 (0) | 5 850 (0.5) |
SGA = small for gestational age
These proportions were not static over time. As a proportion of all live births, low birthweight remained steady (p for trend = 0.196) at around 6% between 1994 and 2012 (Figure 1). However, during the same period, there was an increase in the proportion of preterm births (p < 0.001) and decrease in the proportion of SGA (p < 0.001).
Figure 1. Trends in proportion of live births that are low birthweight, small for gestational age and preterm, NSW, 1994–2012 (click to enlarge)

Infant mortality was higher in each of the groups of interest than in well-grown term infants: mortality rates in low-birthweight infants (2.7%) and preterm birth infants (2.3%) were more than 20 times that of well-grown term infants (0.1%) (Table 2). Mortality in SGA infants (0.5%) was lower than for low-birthweight or preterm infants, but also higher than well-grown term infants. The potential indicators for growth restriction at term (low birthweight at term and SGA at term) both showed higher mortality than the well-grown term infants (0.7% and 0.3%), but mortality in these groups was lower than in the corresponding groups that contained preterm births. The magnitude of the difference between the groups was smaller for childhood mortality, but the pattern of the differences remained unchanged.
Table 2. Summary of outcome measures, by indicator-defined groups: singleton live births in NSW, 1994–2006
| Potential indicators | ||||||
| Outcome | Comparison group: well-grown term infants |
Low birthweight (<2500 g) | Preterm | SGA at all gestational ages | Low birthweight at term | SGA at term |
| Proportion of study populationa | 84.3% | 4.4% | 5.2% | 10.7% | 1.7% | 10.2% |
| Mortality % | ||||||
| Infant | 0.1 | 2.7 | 2.3 | 0.5 | 0.7 | 0.3 |
| Childhood | 0.2 | 2.9 | 2.4 | 0.6 | 0.9 | 0.4 |
| Infant admissionsb % | ||||||
| 0 | 83.0 | 72.8 | 72.7 | 80.9 | 78.3 | 81.5 |
| 1 | 13.2 | 18.0 | 18.4 | 14.1 | 15.2 | 13.8 |
| 2+ | 3.8 | 9.3 | 8.9 | 4.9 | 6.6 | 4.6 |
| Childhood admissionsc % | ||||||
| 0 | 59.6 | 49.4 | 48.8 | 57.3 | 54.7 | 57.9 |
| 1 | 23.8 | 24.3 | 25.0 | 24.0 | 23.8 | 23.9 |
| 2+ | 16.6 | 26.3 | 26.3 | 18.7 | 21.6 | 18.1 |
| NAPLAN – below NMS % | ||||||
| Reading | 7.2 | 13.9 | 11.8 | 11.2 | 14.1 | 11.0 |
| Numeracy | 5.7 | 13.1 | 10.5 | 9.9 | 13.5 | 9.6 |
SGA = small for gestational age (<10th percentile); NMS = national minimum standard
a Note that data on all outcomes was not available for all birth cohorts, so the number of infants included differs by outcome
b Admissions up to age 1 year, excluding admissions in the first 7 days of life
c Admissions from 1–5 years of age
Infants in all groups defined by the potential indicators were more likely to have infant and childhood hospitalisations than well-grown term infants. The low-birthweight group had the highest proportion of infants with two or more hospitalisations in the first year of life (9.3%, compared with 3.8% for well-grown term infants).
Among infants with at least one linked educational record (n = 577 193), well-grown term infants had the lowest proportions that performed below the national minimum standard in reading or numeracy. Compared with well-grown term infants, substantially higher proportions of children fell below the national minimum standard in the low birthweight, SGA and preterm groups (Table 2).
The low-birthweight indicator captured a smaller proportion of each of the outcomes of interest at a population level than reporting preterm births and either low birthweight or SGA at term. Of the 1155 infant deaths, 51% (n = 590) occurred in the low-birthweight group (Figure 2). In comparison, the two indicators preterm births and infants born SGA at term accounted for 63% (n = 730) of the infant mortality, and the group defined by preterm birth or low birthweight at term accounted for 56% (n = 646) of infant mortality. For all outcomes, low birthweight alone identified a smaller proportion of the infants affected than if preterm birth and an indicator of growth restriction at term were used. Although the risk of each of the poor outcomes was higher in the low birthweight at term group than the SGA at term group (Table 2), the indicator combination of preterm birth and SGA at term captured a greater proportion of each outcome than the one including low birthweight at term, due to the larger number of infants included.
Figure 2. Proportion of children with poor outcomes identified by low birthweight, preterm and SGA at term, and preterm and low-birthweight indicators (click to enlarge)
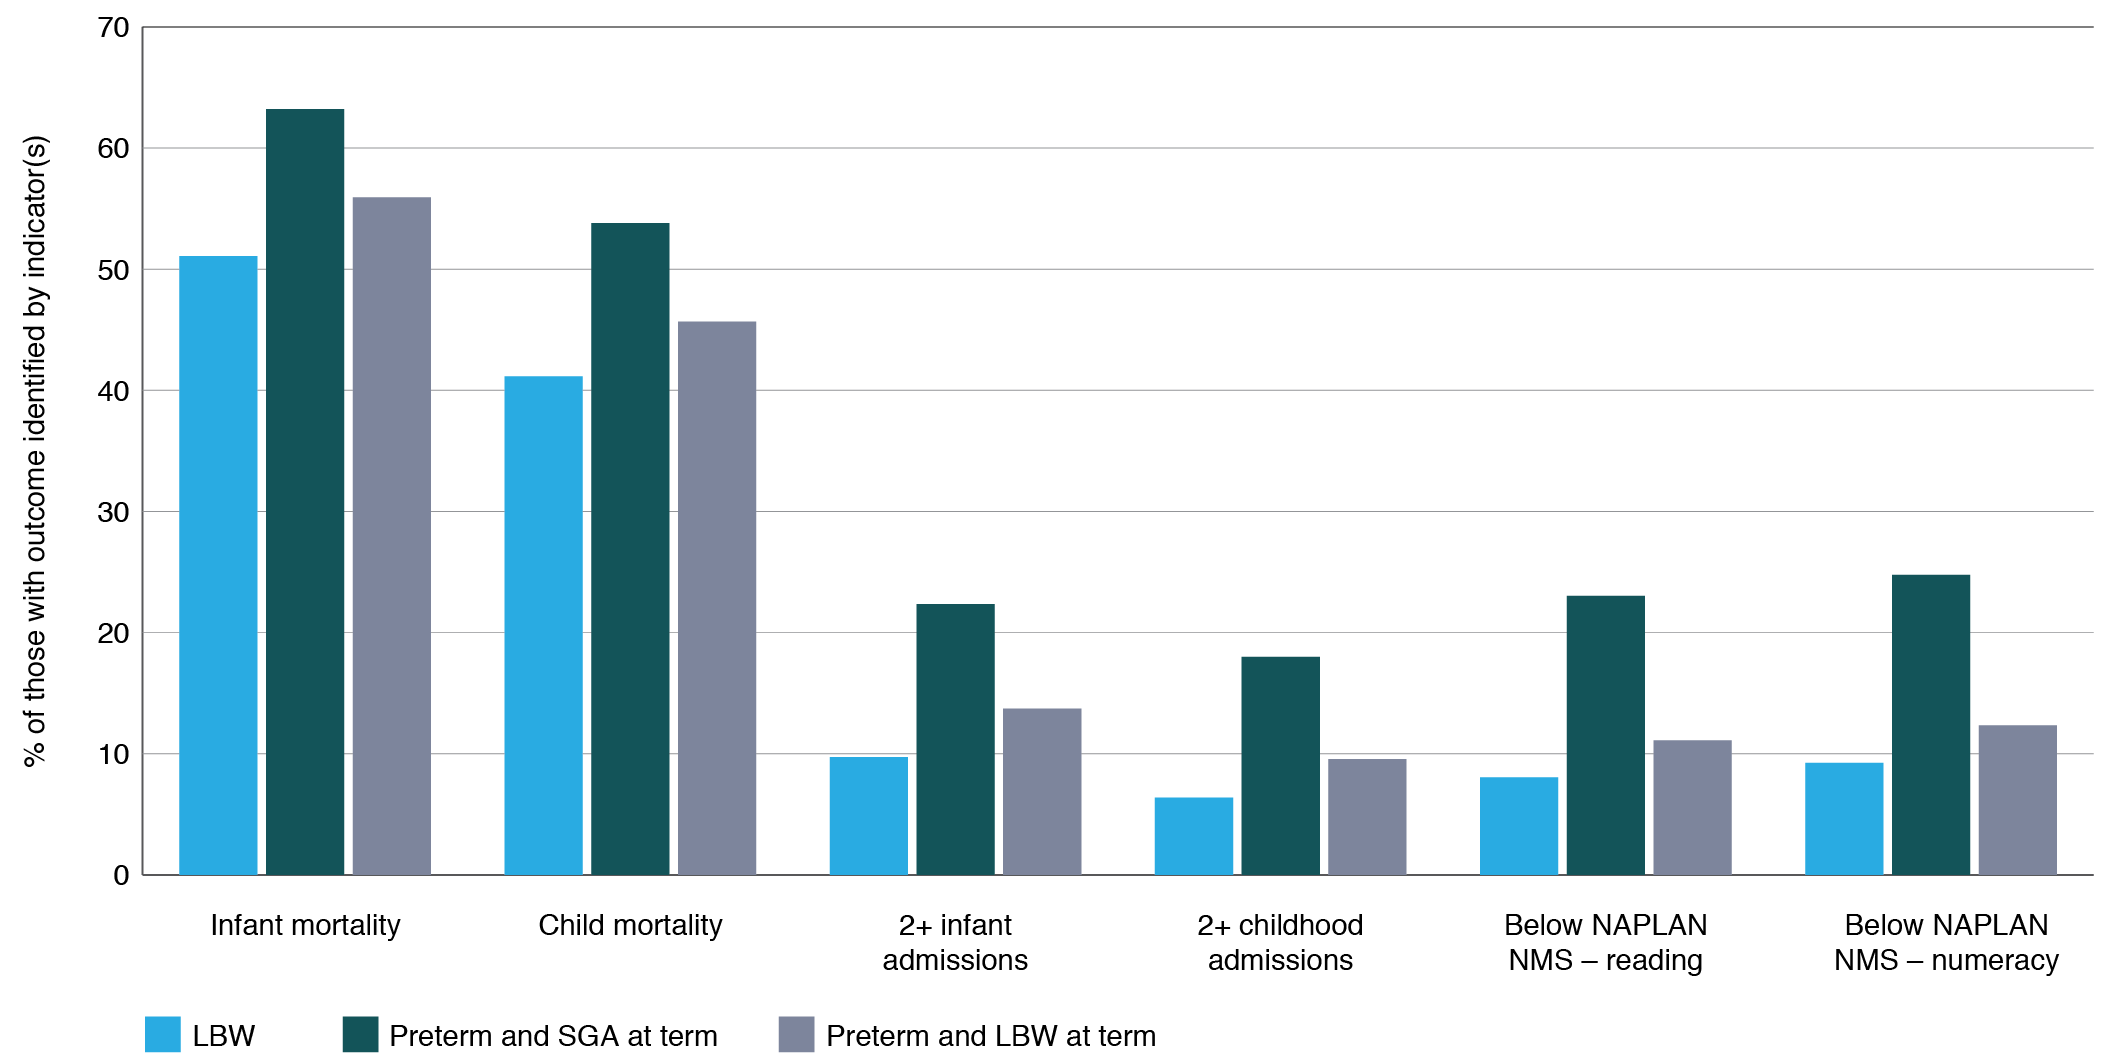
LBW = low birthweight; NAPLAN = National Assessment Program – Literacy and Numeracy; SGA = small for gestational age; NMS = national minimum standard
Discussion
The indicators of low birthweight, SGA and preterm birth identified overlapping groups of infants. Each group showed increased risk for all adverse outcomes compared to well-grown term infants, which is consistent with previous findings that low birthweight1,17, SGA18,19and preterm4,20,21 infants are at increased risk of mortality, morbidity and poorer developmental and educational outcomes. No single indicator captured all these infants, but only 28% were low birthweight. Almost half (47%) of the preterm infants weighed 2500 g or more. Low birthweight was even less sensitive for identifying infants with probable IUGR, as only 20% of SGA infants had a birthweight below 2500 g. A 2013 review of SGA, low birthweight and preterm birth in low- and middle-income countries similarly showed low birthweight had poor sensitivity for identifying groups at increased risk, as it captured less than half of the infants born preterm or SGA.22
As well as having poor sensitivity for identifying SGA and preterm births, low birthweight is problematic as it can be affected by factors that decrease birthweight without increasing the risk of poorer health outcomes. For example, infants born to mothers who live at high altitudes are more likely to be low birthweight, but the birthweight-specific mortality for the high-altitude low-birthweight infants is lower than for low-birthweight infants born at lower altitudes.23 In contrast, preterm birth and IUGR are conditions consistently associated with poorer childhood outcomes, as well as being potentially modifiable, making them good candidate indicators for identifying groups at increased risk. Although some of the difference in proportions of adverse outcomes seen in this study may be due to confounding by factors such as maternal age and socioeconomic status, other studies have shown that most of the increased risk remains after adjusting for these factors.24,25 Adjustment for potential confounders was not appropriate in our study as we wanted to assess the usefulness of indicators at a population level.
Preterm birth can be captured at a population level by reporting the proportion of births that occur before 37 weeks gestation, provided accurate gestational age is determined and recorded. An indicator of IUGR in term births should also be reported. Accurate determination of IUGR for all infants is not feasible, but some measure of size at term would be an appropriate proxy. Mean birthweight at term, the proportion of infants that are low birthweight at term or the proportion of infants that are SGA at term are options. Mean birthweight at term has been suggested elsewhere as an indicator23, and is appealingly simple, however the associated level of risk cannot be calculated as easily as with low birthweight or SGA where infants are divided into ‘exposed’ and ‘unexposed’ groups.
Reporting the proportion of infants that are low birthweight at term as an indicator has the benefit of being simple to determine, but does not take into account the lower mean birthweight of female infants compared with males. Additionally, low-birthweight births at term are likely to be a small proportion of all births, so in smaller populations a difference of only a few births could have a large relative effect on the proportion, making comparisons between groups less precise.
SGA takes gender into account and identifies a larger proportion of infants, but requires that the same set of birthweight percentiles be used for the populations being compared. The sensitivity and specificity of different birthweight percentiles for identifying IUGR is a consideration. The 10th birthweight percentile cut-off may result in some constitutionally small infants without IUGR being included, while a lower cut-off such as the 5th percentile minimises this issue but will likely underestimate the proportion of infants who have IUGR.
As low birthweight only identifies approximately half of preterm births and 20% of SGA infants, many of the outcomes associated with the conditions that low birthweight is intended to capture are being missed. For example, 51% of infant mortality was in infants who were low birthweight. However, if preterm birth and SGA at term as defined by the <10th percentile were used as indicators, 63% of infant mortality would be captured. Although infants born at term with a birthweight below 2500 g had higher infant mortality than SGA-term infants (0.7% vs. 0.3%), term low-birthweight infants make up such a small proportion of all births that this group accounts for far less infant mortality at a population level. Identifying a smaller group that is at higher risk may be appropriate if the aim is to direct targeted prevention measures, and low birthweight at term does not rely on using a single set of birthweight standardised percentiles for all groups to be compared.
Strengths and limitations
The strengths of this study include the population-based design and the large study population, covering almost all births in NSW over more than 20 years. A limitation is that information was not available on all outcomes for every birth cohort included in the study. Additionally, NAPLAN results were only available from government schools.
Conclusion
Although low birthweight is widely used to identify infants at greater risk of adverse outcomes, we found that in this population, low birthweight only identified 28% of the infants at increased risk. Low birthweight is used as a proxy measure for two important predictors of infant and child health: preterm birth and intrauterine growth restriction, but we found that almost half of the preterm births and the majority of SGA infants were not low birthweight; hence the low birthweight indicator greatly underestimates the prevalence of these conditions. In populations where gestational age can be accurately determined and is routinely reported in birth records, an indicator of preterm births and an indicator of size at term will better identify vulnerable groups, and provide a better estimate of the magnitude of the issue. This, in turn, will allow for more meaningful comparison of populations, the monitoring of trends, and the evaluation of interventions to improve maternal health.
Acknowledgements
We thank the NSW Ministry of Health and the NSW Department of Education and Communities for provision of population data, and the NSW Centre for Health Record Linkage for record linkage. This work was supported by a Population Health and Health Services Research Support Program, funded by the NSW Ministry of Health.
This work was completed while DH was employed as a trainee in the NSW Biostatistics Training Program funded by the NSW Ministry of Health. She undertook this work while based at the Kolling Institute.
ST was supported by a grant from the NSW Ministry of Health Prevention Research Support Program and CR was supported by a National Health and Medical Research Council Senior Research Fellowship grant.
We are grateful to Amina Khambalia for reviewing an earlier version of this manuscript.
Peer review and provenance
Externally peer reviewed, not commissioned.
Copyright:

© 2021 Hennessy et al. This work is licensed under a Creative Commons Attribution-NonCommercial-ShareAlike 4.0 International Licence, which allows others to redistribute, adapt and share this work non-commercially
References
- 1. United Nation Children's Fund and World Health Organization. Low birthweight: country, regional and global estimates. New York: UNICEF; 2004 [cited 2021 Mar 22]. Available from: apps.who.int/iris/bitstream/handle/10665/43184/9280638327.pdf?sequence=1&isAllowed=y
- 2. Dunn PM. Arvo Ylppo (1887–1992): pioneer of Finnish paediatrics. Arch Dis Child Fetal Neonatal Ed. 2007;92(3):F230–2. CrossRef | PubMed
- 3. Longo S, Bollani L, Decembrino L, Di Comite A, Angelini M, Stronati M. Short-term and long-term sequelae in intrauterine growth retardation (IUGR). J Matern Fetal Neonatal Med. 2013;26(3):222–5. CrossRef | PubMed
- 4. Lain SJ, Nassar N, Bowen JR, Roberts CL. Risk factors and costs of hospital admissions in first year of life: a population-based study. J Pediatr. 2013;163(4):1014–9. CrossRef | PubMed
- 5. Institute of Medicine (US) Committee on Improving Birth Outcomes. Improving birth outcomes: meeting the challenge in the developing world. Washington DC: National Academies Press (US); 2003.
- 6. Public Health Agency of Canada. Canadian perinatal health report 2008. Ottawa: Public Health Agency of Canada; 2008 [cited 2021 Mar 25]. Available from: ghdx.healthdata.org/record/canadian-perinatal-health-report-2008
- 7. WHO Expert Committee on Physical Status. Physical status: the use and interpretation of anthropometry. Geneva: WHO; 1995 [cited 2021 Mar 25]. Available from: apps.who.int/iris/bitstream/handle/10665/37003/WHO_TRS_854.pdf?sequence=1
- 8. Australian Curriculum Assessment and Reporting Authority. National assessment program literacy and numeracy: 2014 technical report. Sydney: ACARA; 2015 [cited 2021 Mar 25]. Available from: www.nap.edu.au/_resources/2014_NAPLAN_technical_report.pdf
- 9. Centre for Health Record Linkage. Quality assurance. Sydney: CHeReL [cited 2016 Aug 9]. Available from: www.cherel.org.au/quality-assurance
- 10. Bentley J, Ford J, Taylor L, Irvine K, Roberts C. Investigating linkage rates among probabilistically linked birth and hospitalization records. BMC Med Res Methodol. 2012;12:149. CrossRef | PubMed
- 11. Hennessy D, Torvaldsen S, Roberts C. Linkage rate between NSW perinatal data collection birth records and government school NAPLAN educational records, by gestational age at birth. Sydney: University of Sydney; 2016 [cited 2021 Apr 12]. Available from: ses.library.usyd.edu.au/bitstream/handle/2123/15755/PDC_NAPLAN_linkage_REPORT.pdf?sequence=2&isAllowed=y
- 12. Taylor L, Pym M, Bajuk B, Sutton L, Travis S, Banks C. New South Wales mothers and babies report,1998. NSW Pub Health Bull. 2000;11(6):97–9. CrossRef | PubMed
- 13. Khambalia AZ, Roberts CL, Nguyen M, Algert CS, Nicholl MC, Morris J. Predicting date of birth and examining the best time to date a pregnancy. Int J Gynaecol Obstet. 2013;123(2):105–9. CrossRef | PubMed
- 14. Dobbins TA, Sullivan EA, Roberts CL, Simpson JM. Australian national birthweight percentiles by sex and gestational age, 1998-2007. Med J Aust. 2012;197(5):291–4. CrossRef | PubMed
- 15. National Assessment Program. Sydney: Australian Curriculum, Assessment and Reporting Authority; 2011. Student participation [cited 2016 Jun 10]; [about 2 screens]. Available from: www.nap.edu.au/naplan/school-support/student-participation
- 16. Tukey JW. Exploratory data analysis. Reading, Massachusetts: Addison-Wesley; 1977.
- 17. Malin GL, Morris RK, Riley R, Teune MJ, Khan KS. When is birthweight at term abnormally low? A systematic review and meta-analysis of the association and predictive ability of current birthweight standards for neonatal outcomes. BJOG. 2014;121(5):515–26. CrossRef | PubMed
- 18. Arcangeli T, Thilaganathan B, Hooper R, Khan KS, Bhide A. Neurodevelopmental delay in small babies at term: a systematic review. Ultrasound Obstet Gynecol. 2012;40(3):267–75. CrossRef | PubMed
- 19. Katz J, Lee ACC, Kozuki N, Lawn JE, Cousens S, Blencowe H, et al. Mortality risk in preterm and small-for-gestational-age infants in low-income and middle-income countries: a pooled country analysis. Lancet. 2013;382(9890):417–25. CrossRef | PubMed
- 20. Kato T, Mandai T, Iwatani S, Koda T, Nagasaka M, Fujita K, et al. Extremely preterm infants small for gestational age are at risk for motor impairment at 3 years corrected age. Brain Dev. 2016;38(2):188–95. CrossRef | PubMed
- 21. Tanis JC, van der Ree MH, Roze E, Huis in 't Veld AE, van den Berg PP, Van Braeckel KN, et al. Functional outcome of very preterm-born and small-for-gestational-age children at school age. Pediatr Res. 2012;72(6):641–8. CrossRef | PubMed
- 22. Lee ACC, Katz J, Blencowe H, Cousens S, Kozuki N, Vogel JP, et al. National and regional estimates of term and preterm babies born small for gestational age in 138 low-income and middle-income countries in 2010. Lancet Glob Health. 2013;1(1):e26–e36. CrossRef | PubMed
- 23. Wilcox AJ. On the importance – and the unimportance – of birthweight. IntJ Epidemiol. 2001;30(6):1233–41. CrossRef | PubMed
- 24. Stephens AS, Lain SJ, Roberts CL, Bowen JR, Nassar N. Survival, hospitalization, and acute-care costs of very and moderate preterm infants in the first 6 years of life: a population-based study. J Pediatr. 2016;169:61–8.e3. CrossRef | PubMed
- 25. Chen J, Chen P, Bo T, Luo K. Cognitive and behavioral outcomes of intrauterine growth restriction school-age children. Pediatrics. 2016;137(4):e20153868. CrossRef | PubMed