Abstract
Objectives: Few existing economic evaluations of telephone call-back services for smoking cessation (quitlines) include productivity measures. The Economics of Cancer Collaboration Tobacco Control (ECCTC) model was developed by adopting a societal perspective, including productivity impacts.
Study type: Economic simulation modelling
Methods: A multi-health state Markov cohort microsimulation model was constructed. The population was the Victorian smoking population in 2018. The effectiveness of the Victorian Quitline was informed by an evaluation and compared with no service. Risks of developing disease for smokers and former smokers were obtained from the literature. The model calculated economic measures, including average and total costs and health effects; incremental cost-effectiveness ratios; and net monetary benefit (NMB) for both the healthcare and societal perspective. An extensive uncertainty analysis was conducted.
Results: The Quitline service is cost-effective and dominant from both healthcare and societal perspectives, reducing costs with greater health benefits compared with no service. The expected incremental NMB was $2912 per person from the healthcare perspective and $7398 from the societal perspective. Total cost savings were $869 035 of healthcare costs, $1.1 million for absenteeism, $21.8 million for lost workforce participation, and $8.4 million for premature mortality, with a total reduction in societal costs of $32.2 million, over the 80 year timeframe of the model. Probabilistic sensitivity analysis suggested a high degree of certainty in these results, and overall conclusions were robust to one-way sensitivity and scenario analyses.
Conclusions: The Victorian Quitline service is cost-effective and should be retained and expanded where possible. The ECCTC model can be adapted to analyse the cost-effectiveness of other tobacco cessation interventions, populations and contexts.
Full text
Introduction
Despite a reduction in prevalence in many developed countries, smoking remains a leading cause of preventable disease. Tobacco use was attributed as the cause of 8.71 million deaths and 7.9% of the overall disease burden globally in 2019.1 In Australia, 20 482 deaths (12.9% of total deaths) and 8.6% of the overall disease burden were attributed to tobacco use in 2018.2 Tobacco use was responsible for one-fifth (21.5%) of overall disease burden due to cancer. Older people, males and areas of low socioeconomic advantage experienced a disproportionate burden of disease due to tobacco in 2018.3
There is also a substantial economic burden due to tobacco use. A comprehensive review of the economic impact of smoking and reducing smoking prevalence found that about 15% of healthcare expenditure in high-income countries can be attributed to smoking.4 For example, £2.7– £5.2 billion (A$5–9.7 billion) in UK healthcare costs annually and between 6% and 18% of healthcare costs in the US were attributable to smoking. US productivity losses due to smoking were estimated to be US$151 billion (A$223 billion) annually.4 The Australian Institute of Health and Welfare (AIHW) recently estimated annual healthcare expenditure attributable to smoking at A$3.3 billion in Australia.5
Two systematic reviews of the economic burden of smoking identified four studies of the Australian population or states or territories. One estimate of productivity loss was A$10.5 billion for one year, as well as A$1.06 billion in taxation forgone due to a reduction in the working life of smokers.6,7 One of the included studies, undertaken for the Australian Government, found the tangible costs due to smoking were A$19.2 billion in 2015.8 Tangible costs are those that result in actual financial impact to an economic agent and for which a market price exists, as the goods or services paid for can usually be traded in the market economy. There were also substantial intangible costs – the monetised value of ill health or loss of life – of A$92 billion due to premature mortality and A$26 billion due to morbidity.8 Another recent study estimated productivity losses of A$388 billion over the lifetime of the 2016 Australian population due to smoking.9
A variety of tobacco control regulations and programs have achieved great success in Australia.10 The prevalence of daily smoking has more than halved over the past three decades among Australians 14 years and over, from 24.3% in 1991 to 11% in 2019.11 The ‘National Preventive Health Strategy’ and the recently released ‘National Tobacco Strategy’ set a smoking prevalence target of 5% or less in adults by 2030.12,13 However, this target is unlikely to be met without an acceleration of the decline in smoking prevalence.
Telephone call-back services for smoking cessation, or quitlines, are one intervention available to policymakers and health providers to assist current smokers to quit. A Cochrane systematic review of telephone counselling for smoking cessation identified 104 trials with 111 653 participants. For smokers who contacted quitlines, quit rates were higher for smokers receiving multiple sessions of proactive counselling compared to providing self-help materials or brief counselling in a single call, with a risk ratio of 1.38 (95% Confidence Interval [CI] 1.19, 1.61).14 For smokers who did not call a helpline, the provision of proactive telephone counselling also increased quit rates, with a risk ratio of 1.25 (95% CI 1.15 to 1.35). In Australia, each of the eight state and territory governments funds a quitline available to all smokers in their jurisdiction. The eight quitline services are delivered by five operators (one operator delivers the quitline in four jurisdictions) using a set of agreed ‘National Quitline™ Minimum Standards’ to ensure consistency of operations and quality across all services.
Greenhalgh et al. reviewed the economic evidence on telephone quitlines and found that all identified studies in Australia, the US, Spain, Sweden, Thailand, and New Zealand supported cost-effectiveness.15 Like most of the existing economic evaluations of call-back services, the Australian studies found quitline services to be cost-saving but did not include productivity measures.16,17 Considering productivity impacts has the potential to more accurately reflect the return on investment for budget directed towards quitline services, particularly when compared with other preventive interventions, healthcare services for acute conditions, or government-funded services more generally.
This study aimed to develop a new economic simulation model to investigate the cost-effectiveness of tobacco cessation interventions, using microsimulation methods and incorporating productivity measures to operationalise a societal perspective. We applied the model to the Victorian Quitline service to measure its cost-effectiveness.
Methods
Reporting is based on the Consolidated Health Economic Evaluation Reporting Standards (CHEERS) 2022 Checklist 18. Additional detail on methodology is included in the Supplementary Material (available from: figshare.com/s/93dcf3720335d110eb35).
Structure
The Economics of Cancer Collaboration Tobacco Control (ECCTC) model is a cohort-based Markov model with microsimulation built in TreeAge (TreeAge Software LLC, Williamstown, Massachusetts, US) with links to Excel (Microsoft Corporation, Redmond, Washington, US). The model predicts the impact of continuing smoking or smoking cessation on future smoking-related morbidity, mortality and associated healthcare and societal costs. There are 18 health states representing each of the 16 included diseases as well as “healthy” and “dead” states (see Tables S1 and S2 in Supplementary Material, available from: figshare.com/s/93dcf3720335d110eb35). A simulated person can only exist in one health state at a time. Smoking status is operationalised through a ‘tracker’ which records changes in smoking status over time, obviating the need for an excessive number of health states. A second tracker is also used to monitor the time after quitting, which informs the probability of relapse. The population of interest was the Victorian smoking population in 2018.
The epidemiology of diseases, mortality, prevalence and incidence was taken from the ‘Global Burden of Disease’ (GBD) study for 2018 for Australia and processed through DisMod II software (Epigear) to produce incidence and case fatality rates per single-year age groups.19 DisMod II is a software tool to help estimate the epidemiology of disease developed for the World Health Organization (WHO) and the GBD studies.20 The software performs various functions using mathematical relationships between incidence, prevalence, remission, case fatality and mortality. As the GBD reports epidemiology in terms of 5-year age groups, DisMod II was used to calculate the model’s single-year age groups. The model calculates average and total costs, benefits, incremental cost-effectiveness ratios and net monetary benefits (NMBs) (based on a A$50,000/quality-adjusted life years (QALY) threshold). Costs are reported in Australian dollars for 2017–18.
Relative risk of developing disease
The relative risk (RR) of developing a disease for current smokers compared to never-smokers was based on a report by the National Drug Research Institute, which was sourced from the GBD study.8,21 The RRs for former smokers were taken from a report by the Royal College of Physicians in the UK.22 We assumed that these RRs for former smokers applied for 20 years after cessation, at which point they became 1 (the same as the general population). This is likely to be a conservative assumption compared with earlier timeframes of reducing risk. Upper digestive diseases and uterine cancer (protective effects linked to smoking) have an immediate reduction of risk to 1 (the same as the general population) upon quitting.
Intervention effectiveness
A previous economic evaluation of the Victorian Quitline service informed the effectiveness of the intervention.17,23 The odds ratio for quitting due to using the Quitline service was 4.23 (95% CI 1.53, 11.7).17,23 The background quit proportion of 3.6% was taken from the same report.17,23 The odds ratio was converted to a RR for use in the model, resulting in a RR of 3.789 (95% CI 1.501, 8.446).
Smokers in the model have a probability of quitting in any year according to the background quit rate. That is, they have a 3.6% chance of quitting every year, for all years, until they quit or die. Smokers in the Quitline intervention have an increased chance of quitting in the first year only, after which the chance of quitting reverts to the background quit rate. This may be a conservative assumption because subsequent quit attempts are likely to be more successful than they would have been without any interaction with Quitline due to the psychoeducation received. However, there is an absence of evidence of this to directly inform the model.
A scenario analysis was performed using a lower effectiveness estimate sourced from a Cochrane Review (RR 1.38; 95% CI 1.19,1.61). This scenario analysis also used the Cochrane Review higher background quit proportion (7.79%).14
Health benefits and utilities
The summary health measure in this analysis is the QALY, which measures quantity and quality of life. The QALYs were derived using disability weights from the GBD study to maintain internal consistency in the model.24 An alternative, more common approach would have been to survey the literature for relevant utility weights derived from one of the multi-attribute, preference-weighted utility instruments (MAUIs). However, due to the large number of diseases in the model, the GBD disability weights were applied. The utility values for each disease, calculation method and source can be found in Table S1 of the Supplementary Material (available from: figshare.com/s/93dcf3720335d110eb35).
Costs
The cost of the Victorian Quitline for one year was A$1 million (via personal communication with Quitline). The per-person cost was calculated by dividing the overall cost by the number of callers: 8023. The total cost of Quitline varied between A$600 000 and A$1.4 million in the sensitivity analysis. The cost per person per disease per year by sex was obtained from the AIHW for the year 2018.5
All productivity measures use the gross weekly earnings, including fringe benefits by age and sex, as recommended by Neumann et al.25 This information was obtained from the Australian Bureau of Statistics ‘Survey of Income and Housing 2017-18′.26
Two perspectives are taken. Firstly, the healthcare perspective includes all health sector costs, whether incurred by government funders or patients, in the form of out-of-pocket costs. Secondly, the societal perspective includes productivity based on three measures but excludes other societal costs, such as environmental impacts. The three types of productivity accounted for (in addition to healthcare costs) were: absenteeism (temporary days away from work due to illness or injury); lost productivity due to reduced participation in the labour force (long-term time away from work due to illness or injury); and productive years of life lost due to premature death (years between death and normal retirement age when the person would have otherwise been working). To calculate absenteeism, the number of days off work per disease was obtained from the ‘National Health Survey 2014–15′.27 The ‘National Health Survey 2017–18′ data could not be used due to differences in questions between surveys and the type of data collected. The number of days off work over a 2-week period as reported in the survey was multiplied by 26 to estimate the annual number of days off work for each disease. The annual number of days off work was then multiplied by the daily equivalent of the earnings for the relevant age and sex to derive the monetised value of lost productivity for those absences.
Participation in the labour force was calculated using participation proportions extracted from the ‘National Health Survey 2014–15′ per disease.27 The differences between the participation proportion for each disease and those without disease were multiplied by the annual earnings for the relevant age and sex.
For the value of productive life years lost, the difference in years between the age of death and normal retirement age – assumed to be 67 years – was multiplied by the annual earnings that otherwise would have been received as a representation of lost productivity.
Uncertainty
Due to imperfect information on the costs and effects of strategies under consideration in economic evaluations, cost-effectiveness results are subject to uncertainty. It is vital that economic evaluations estimate the level of uncertainty associated with summary measures so that decision makers can assess the degree of confidence in the results of the analysis in their decision making.
We have considered two sources of uncertainty: deterministic (input values mathematically determine the same output) and stochastic (output is subject to randomness and input values).
Two kinds of deterministic uncertainty have been described for the relevant parameters above: univariate sensitivity analysis and scenario analysis.
Two kinds of stochastic uncertainty are considered in the ECCTC model using Monte Carlo simulation . ‘First-order uncertainty’ refers to the population’s underlying variability and characteristics.28 In this case, the probabilities of developing disease and other events and values, such as disease costs, were age and sex specific. ‘Second-order uncertainty’ refers to the known variability around parameters, which was accounted for using probabilistic sensitivity analysis.28 Probabilistic sensitivity analysis involves drawing model input variables from probability distributions rather than them being treated as a fixed value. The choice of distributions and their parameters are detailed in the Supplementary Material (available from: figshare.com/s/93dcf3720335d110eb35). We accounted for first order uncertainty by the use of the Victorian Quitline sample of n = 8032 simulated individuals to represent the Victorian smoking population. Second order uncertainty was accounted for by running the simulation 3000 times.
Reporting economic results
Health economic results are predominantly reported in terms of an incremental cost-effectiveness ratio. This represents the difference in costs divided by the difference in QALYs, and the lower, the better because this indicates more health gains for money spent. This is a common measure used to indicate the relative cost-effectiveness of an intervention. The denominator can be any health measure, such as QALYs, suicides avoided, or hospitalisations avoided. However, cost per QALY is the most common because of commonly-used decision rules; specifically, positive ICERs up to $50,000/QALY are generally considered cost-effective. The word dominant is used in place of a negative ICER. Negative ICERs cannot be reported because they could result from a reduction in costs and increase in health or an increase in costs and a reduction in health, two drastically different outcomes. Dominant indicates the intervention is expected to result in greater health and reduced costs compared with business as usual. Dominated indicates the intervention is expected to result in less health and greater costs compared with business as usual. Bayesian credible intervals (CrI) are used in place of confidence intervals when reporting results due to the use of Monte Carlo simulation to estimate statistical variability around estimates.
Results
Base case results
Over the 80 year timeframe of the modelled analysis, the estimated mean total healthcare costs per person were $19 962 without Quitline and $19 876 with Quitline, meaning Quitline provided a healthcare cost saving of $86 per smoker on average (costs are reported in Australian dollars for 2017–18). The mean effectiveness per person was 11.506 QALYs gained without Quitline, and 11.563 for the Quitline strategy, an average incremental effectiveness of 0.057 QALYs per person. From a healthcare perspective, the analysis found that the Victorian Quitline service dominated the ‘do nothing’ approach (95% credible interval (CrI) Dominant to $5855) (Table 1), i.e., the service saved costs and improved health. The incremental NMB was $2912 (95% CrI $454 to $7903), where a positive incremental NMB indicates the preferred, cost-effective strategy. From the societal perspective, the Victorian Quitline service also dominated the ‘do nothing’ approach (95% CrI dominant to dominant). However, the costs for both strategies were higher due to the broader inclusion of costs for this perspective. The incremental cost saving was $4572, and the incremental effects were the same as for the healthcare perspective. The incremental NMB was $7398 (95% CrI $1116 to $20 101). The cost-effectiveness of the Quitline service from both healthcare and societal perspectives was driven by the lower proportion of people still smoking by the end of the model: 39.98% for Quitline compared with 42.43% for the ‘do nothing’ approach (i.e., having no quitline service). This equates to 196 (95% CrI 34 to 511) fewer smokers for the 2018 Victorian smoking cohort.
Base case results were also summed for the entire modelled cohort of 8023 Victorian smokers who, it was estimated, contacted Quitline in 2018, with totals reported by type of cost, where healthcare cost is net of the cost of providing the Quitline intervention (Table 2). The total healthcare cost saving was $869 035, absenteeism cost saving was $1.15 million, the reduction in lost workforce participation costs was $21.77 million, and the reduction in productivity costs of premature death was $8.41 million, discounted, over the 80 year timeframe of the model. This added up to a reduction in total societal costs of $32.19 million.
Table 1. Modelled analysis of Quitline Victoria: incremental results per person, base case
| Strategy | Cost ($)a | Effectiveness (QALYs) | Incremental cost ($) | Incremental effectiveness (QALYs) | ICER ($/QALY) | NMB ($)d | Smokers (%) | Incremental smokers (n) |
| Health care perspective | ||||||||
| Do nothingb | 19 962 (19 550 to 20 400) |
11.506 (11.414 to 11.592) |
n/a | n/a | n/a | n/a | 42.43 (31.46 to 54.34) |
n/a |
| Quitlinec | 19 876 (19 465 to 20 376) |
11.563 (11.444 to 11.711) |
–86 (–293 to 69) |
0.057 (0.010 to 0.155) |
Dominant (Dominant to 5 855) |
2 912 (454 to 7 903) |
39.98 (28.14 to 52.69) |
–196 (–511 to –34) |
| Societal perspective | ||||||||
| Do nothing | 214 862 (208 692 to 221 168) |
11.506 (11.414 to 11.592) |
n/a | n/a | n/a | n/a | 42.43 (31.46 to 54.34) |
n/a |
| Quitline | 210 290 (198 801 to 218 924) |
11.563 (11.444 to 11.711) |
–4 572 (–12 394 to –607) |
0.057 (0.010 to 0.155) |
Dominant (Dominant to Dominant) |
7 398 (1 116 to 20 101) |
39.98 (28.14 to 52.69) |
–196 (–511 to –34) |
ICER = incremental cost-effectiveness ratio; n/a = not applicable; NMB = net monetary benefit; QALY = quality-adjusted life years
Notes: All cost figures are in Australian dollars
Figures in parentheses report the 95% credible interval.
a Cost refers to the combination of all costs included for the relevant perspective. From the healthcare perspective, this includes the cost of telephone call-back service and any disease expenditure savings due to averted illness. The societal perspective includes healthcare costs as well as productivity measures, absenteeism, lost workforce participation, and years of productive life years lost due to premature mortality.
b Costs for the ‘Do nothing’ scenario are essentially the costs of tobacco-related disease.
c Costs for the Quitline intervention include the costs of disease plus the cost of the intervention and cost savings due to disease averted.
d Net monetary benefit is calculated using a $50 000/QALY cost-effectiveness threshold.
The proportion of smokers is based on the smoking status of a microsimulation at the end of the timeframe, essentially at the point of death.
Table 2. Modelled analysis for Quitline Victoria: total cohort results, base case, disaggregated societal perspective
| Strategy | QALYs | Healthcare cost ($) | Absenteeism cost ($) | Lost workforce participation cost ($) | Premature death cost ($) | Total societal cost ($) | NMB ($) |
| Do nothing | 91 741 (91 076 to 92 392) |
168 007 939 (165 573 042 to 170 464 691) |
50 962 937 (49 180 340 to 52 747 485) |
926 837 377 892 300 170 to 960 611 841) |
611 177 927 (599 579 730 to 625 535 787) |
1 756 986 179 (1 706 514 264 to 1 809 720 165) |
2 830 072 802 (2 744 087 139 to 2 913 177 515) |
| Quitline | 92 164 (91 324 to 93 312) |
167 138 903 162 475 751 to 170 041 326) |
49 816 910 (46 973 536 to 51 976 908) |
905 068 830 848 717 291 to 946 456 198) |
602 771 679 (580 698 247 to 617 706 014) |
1 724 796 322 (1,640 488 573 to 1 785 553 638) |
2 883 425 765 (2 780 870 859 to 3 025 255 863) |
| Difference | 423 (53 to 1 296) |
–869 035 (–4 665 362 to 633 763) |
–1 146 027 (–3,006 580 to –247 104) |
–21 768,547 (–59 524 280 to –4 339 675) |
–8 406 247 (–25,161 428 to –183 719) |
–32,189,857 (–92 056 808 to –5 705 171) |
53 352 963 (8 936 780 to 155 967 243) |
All cost figures are in Australian dollars
NMB: net monetary benefit; QALY: quality-adjusted life year. NMB was calculated using a $50 000/QALY cost-effectiveness threshold.
Figures in parentheses report the 95% credible interval.
Negative figures indicate cost savings.
Costs for the ‘do nothing’ scenario are essentially the costs of tobacco-related disease. Costs for the Quitline intervention include the costs of disease plus the cost of the intervention and cost savings due to disease averted
Probabilistic sensitivity analysis
The scatterplot (Figure 1) represents the results of the simulation on the cost-effectiveness plane. Results in the southeast quadrant indicate dominant results because they are cost-saving and increase health. Close to 99% of the simulation runs appear underneath the threshold and in the southeast quadrant, indicating a high degree of certainty that Quitline was cost-effective and cost-saving based on this model’s structure, input data and assumptions.
Figure 1. Incremental cost-effectiveness scatterplot, base case, societal perspective (click figure to enlarge)
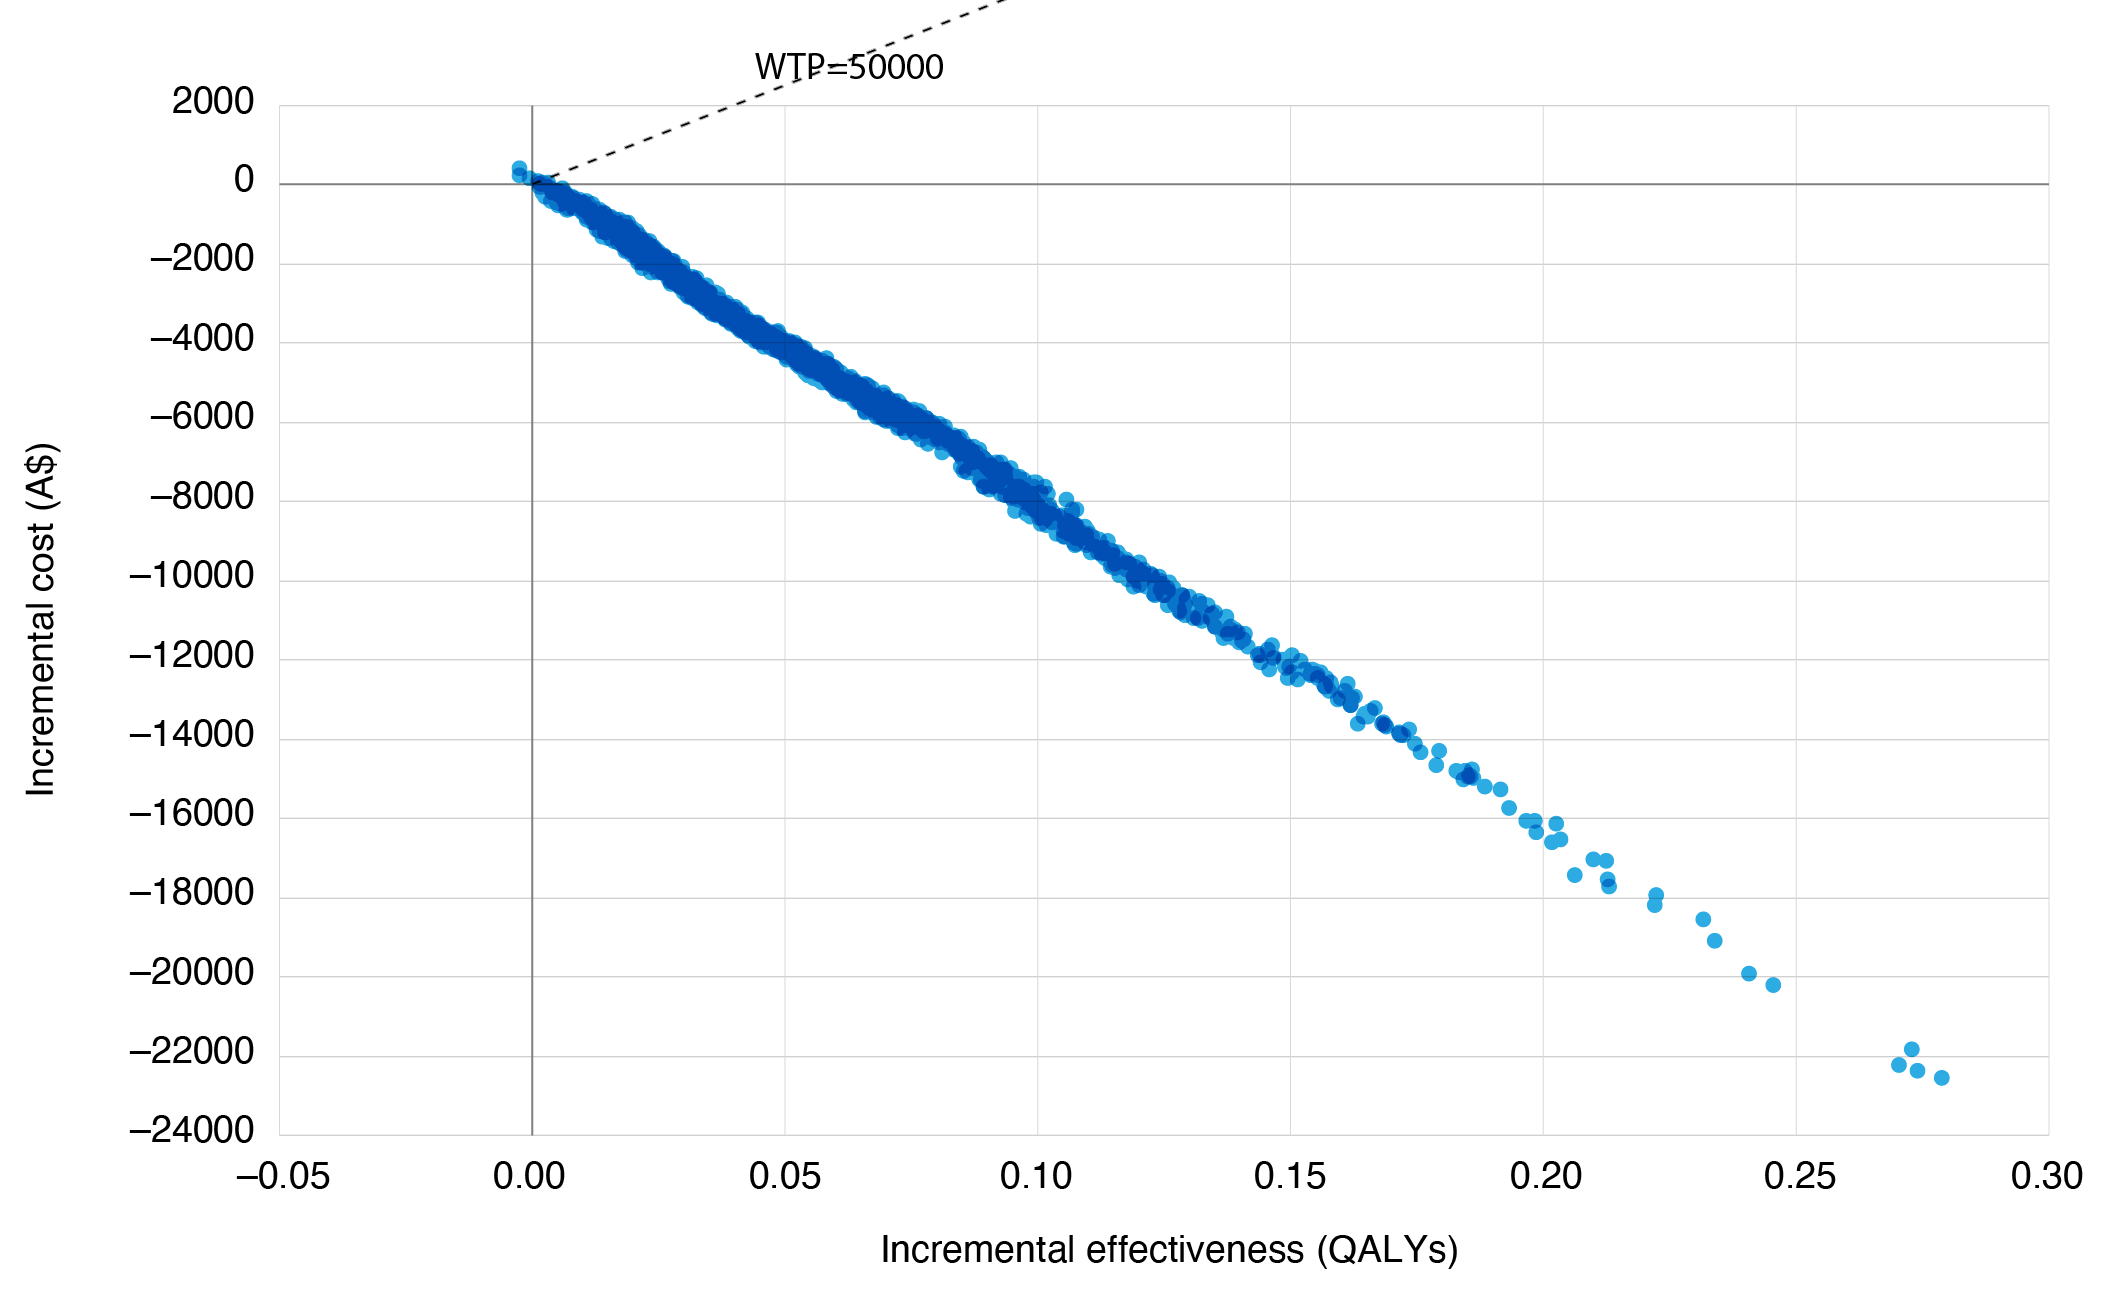
QALYs = quality-adjusted life years; WTP= willingness to pay, in this case representing the cost-effectiveness threshold of $50 000 QALY.
Notes: Each of the dots indicates one of the simulation runs. The dotted black line indicates the cost-effectiveness threshold ($50 000 per additional QALY). The majority of the simulation runs are below the cost-effectiveness threshold and sit in the southeast quadrant (lower costs, better health), indicating a high degree of certainty that the Victorian Quitline service saves costs and improves health compared with no Quitline
One-way sensitivity and scenario analysis
The cost-effectiveness of Victorian Quitline remained robust to a variety of uncertainty analyses (see online Supplementary Material, available from: figshare.com/s/93dcf3720335d110eb35). The greatest change in mean ICER was due to varying effectiveness. When the relative risk from the meta-analysis in the Cochrane systematic review was used to represent Quitline effectiveness and the baseline quit rate from the comparator cohort in this study was applied (7.79% vs. 3.6% in the base case), the ICER was $14 204/QALY for the healthcare perspective and dominant for the societal perspective.
Discussion
This article documents the development of a new economic model for analysing the cost-effectiveness of tobacco cessation interventions. The first application of this model to the Victorian Quitline telephone call-back service described here found that Quitline was dominant from both the healthcare and societal perspectives, reducing costs and improving health. These findings were robust to changes in the input data on intervention effectiveness, sex-based earnings, time lags and variations in the parameters for time horizon, discount rate, the total cost of the service and number of callers. When the effects were summed over the total population of smokers who contact Quitline, it was estimated that the following reductions in costs occur: $869 035 for healthcare (net of the cost of the Quitline intervention), $1.15 million in absenteeism due to temporary absences from work, $21.77 million in reduced workforce participation and $8.41 million in the value of productive life years lost due to premature mortality over the 80 year timeframe of the model.
The findings of this study are consistent with the results of previous research. McCaffrey et al. and Lal et al. found that the Victorian Quitline service was dominant based on the healthcare perspective alone without productivity measures.16,17 Reviews of quitline service economic evaluations have consistently found that they are cost-effective or cost-saving.15 Although quitlines are usually found to be effective and cost-effective for the smokers that come in to contact with these services, the impact they can have at the population level is limited by the proportion of all smokers that are aware of, and engage with, the intervention, combined with the capacity of the service to meet this demand. For example, in our model, only 1.3% of the Victorian smoking population engaged with Quitline in a given year. Economic evidence from New Zealand supports the notion that a quitline combined with its promotion in mass media as an integrated package result in substantial cost savings, health benefits, and greater health gains for priority populations.29
One of the unique aspects of this ECCTC model was the adoption of a limited societal perspective by adding productivity measures. As is generally the case with economic analyses of preventive interventions, the productivity impacts were much greater than the differences in healthcare costs between the intervention and doing nothing. Although the societal perspective, in this case, simply served to reinforce the cost-effectiveness based on healthcare costs alone, the results provide useful information on productivity impacts at the level of the total cohort. Enhancing the return on investment of a quitline service may be of interest to decision makers when considering establishing or resourcing quitlines and/or investing in initiatives that increase the use of quitlines, for example, integrated multimedia campaigns that promote self-referrals to the quitline or initiatives that increase health professional referrals to the quitline.
Another strength of the ECCTC model is the consideration of multiple types of uncertainty. First-order uncertainty – the variation of underlying characteristics of the population – was taken into account through microsimulation, with the hypothetical cohort of Quitline callers being randomly selected from the age and sex distribution of Victorian smokers. Second-order uncertainty, the stochastic variation of input data, was considered through probabilistic sensitivity analysis and Monte Carlo simulation. This type of uncertainty analysis indicated a high degree of certainty that the Victorian Quitline service dominates the ‘do nothing’ approach, as nearly all simulations returned a positive incremental NMB.
Limitations
This analysis has a number of limitations. This is a new economic model that has been developed to analyse the cost-effectiveness of tobacco cessation interventions in the Australian context. With this comes a degree of uncertainty due to model structure and the various methodological choices taken while building the model that would be better tested by investigating more than a single intervention. As with all simulation models, the results represent the best estimate of a potential effect at the time of construction of the model without stronger direct evidence. Models simplify reality, and judgments and choices need to be made about the most relevant and appropriate methodological approaches. However, comprehensive sensitivity analyses were conducted, and results were robust to changes in key model inputs and assumptions.
It could be argued that the outcome measure in this analysis should be referred to as DALYs (disability-adjusted life years) rather than QALYs. However, in the burden of disease studies, DALYs are calculated by adding years of life lost and years lived with disability compared against an aspirational lifetable. An aspirational life table was not applied in this analysis; disability weights were only used to derive health-adjusted utilities while simulations were in a diseased state. Hence health outcomes are considered QALYs. An alternative approach would have been to use utility weights based on MAUIs. Utility weights derived from a diverse range of literature, including a wide range of MAUIs and different populations, would potentially introduce bias to the model. Using disability weights from the GBD study means all the utilities in the ECCTC model were generated from the same study and the same large, albeit global, population. This general approach has precedent in prior tobacco cessation economic studies.30
Conclusion
The findings of this economic model suggest the Victorian Quitline service is highly cost-effective, saving costs and improving health. One of the unique aspects demonstrated by this analysis is the substantial productivity improvements associated with the provision of the Victorian Quitline service.
Based on the findings, quitline services should be resourced to provide smoking cessation counselling to the greatest possible number of smokers. Investments in initiatives that increase the use of such services are likely to have a strong return through enhanced health benefits and cost savings.
There are also opportunities to further develop this new economic model to aid decision-making about tobacco control measures by state and federal governments as well as non-government organisations interested in reducing the health burden of tobacco use.
Acknowledgements
The authors would like to acknowledge the work of the Australian Institute of Health and Welfare; the Institute’s estimates of disease expenditure per case of disease were critical to our economic model. The epidemiological estimates of tobacco-attributable disease burden sourced from the Institute for Health Metrics and Evaluation for the ‘Global Burden of Disease’ study was another set of important input data.
Peer review and provenance
Externally peer reviewed, not commissioned.
Copyright:

© 2023 Crosland et al. This work is licensed under a Creative Commons Attribution-NonCommercial-ShareAlike 4.0 International Licence, which allows others to redistribute, adapt and share this work non-commercially provided they attribute the work and any adapted version of it is distributed under the same Creative Commons licence terms.
References
- 1. Institute for Health Metrics and Evaluation. GBD Compare. US: University of Washington; 2022 [cited 2022 Jun 2]. Available from: vizhub.healthdata.org/gbd-compare/
- 2. Australian Institute of Health and Welfare. Australian burden of disease study: impact and causes of illness and death in Australia, 2018. Risk factor estimates for Australia – Supplementary material. Canberra: AIHW; 2021 [cited 2023 May 5]. Available from: www.aihw.gov.au/reports/burden-of-disease/abds-methods-supplementary-material-2018/contents/about
- 3. Australian Institute of Health and Welfare. Australian Burden of Disease Study: impact and causes of illness and death in Australia 2018. Canberra: AIHW; 2021 [cited 2023 May 5]. Available from: Available from: www.aihw.gov.au/getmedia/c5ea1fc8-5ec9-46f8-a8f3-a297a0df8150/aihw-bod-27.pdf.aspx?inline=true
- 4. Ekpu VU, Brown AK. The economic impact of smoking and of reducing smoking prevalence: review of evidence. Tob Use Insights. 2015;8:1–35. CrossRef | PubMed
- 5. Australian Institute of Health and Welfare. Health system spending per case of disease and for certain risk factors. Canberra: AIHW; 2022 [cited 2022 Jun 2]. Available from: www.aihw.gov.au/reports/health-welfare-expenditure/health-system-spending-per-case-of-disease/contents/risk-factors
- 6. Crosland P, Ananthapavan J, Davison J, Lambert M, Carter R. The economic cost of preventable disease in Australia: a systematic review of estimates and methods. Aust N Z J Public Health. 2019;43(5):484–95. CrossRef | PubMed
- 7. Makate M, Whetton S, Tait RJ, Dey T, Scollo M, Banks E, et al. Tobacco cost of illness studies: a systematic review. Nicotine Tob Res. 2020;22(4):458–65. CrossRef | PubMed
- 8. Whetton S, Tait RJ, Scollo M, Banks E, Chapman J, Dey T, et al. Identifying the social costs of tobacco use to Australia in 2015/16. Perth: National Drug Research Institute; 2019 [cited 2023 May 11]. Available from: Available from: ndri.curtin.edu.au/NDRI/media/documents/publications/T273.pdf
- 9. Owen AJ, Maulida SB, Zomer E, Liew D. Productivity burden of smoking in Australia: a life table modelling study. Tob Control. 2019;28(3):297–304. CrossRef | PubMed
- 10. Greenhalgh EM, Scollo MM, Winstanley MH. Tobacco in Australia: facts and issues. Melbourne: Cancer Council Victoria; 2023 [cited 2023 May 29]. Available from:www.tobaccoinaustralia.org.au/introduction
- 11. Australian Institute of Health and Welfare. Data tables: National Drug Strategy Household Survey 2019 - 2.Tobacco smoking chapter, Supplementary data tables. Canberra: AIHW, 2020 [cited 2023 May 29]. Available from: www.aihw.gov.au/reports/illicit-use-of-drugs/national-drug-strategy-household-survey-2019/data
- 12. Australian Government. National Preventive Health Strategy 2021–2030 Canberra: Department of Health and Aged Care; 2021 [cited 2023 May 29]. Available from: www.health.gov.au/sites/default/files/documents/2021/12/national-preventive-health-strategy-2021-2030_1.pdf
- 13. Australian Government. National Tobacco Strategy 2023–2030. Canberra: Department of Health and Aged Care, 2023 [cited 2023 May 29]. Available from: www.health.gov.au/resources/publications/national-tobacco-strategy-2023-2030
- 14. Matkin W, Ordonez-Mena JM, Hartmann-Boyce J. Telephone counselling for smoking cessation. Cochrane Database Syst Rev. 2019;5:CD002850. CrossRef | PubMed
- 15. Greenhalgh EM, Hurley S, Lal A. Economic evaluations of tobacco control interventions. In: Greenhalgh EM, Scollo M, Winstanley M, eds. Tobacco in Australia: Facts & issues. Victoria: Cancer Council Victoria; 2020.
- 16. Lal A, Mihalopoulos C, Wallace A, Vos T. The cost-effectiveness of call-back counselling for smoking cessation. Tob Control. 2014;23(5):437–42. CrossRef | PubMed
- 17. McCaffrey N, Carter R. Economic evaluation of the Victorian Quitline service. Melbourne: Deakin Health Economics, Deakin University and Cancer Council Victoria, 2018 [cited 2023 May 11]. Available from: www.quit.org.au/documents/245/Economic_evaluation_of_the_Victorian_Quitline_service.pdf
- 18. Husereau D, Drummond M, Augustovski F, de Bekker-Grob E, Briggs AH, Carswell C, et al. Consolidated Health Economic Evaluation Reporting Standards 2022 (CHEERS 2022) statement: updated reporting guidance for health economic evaluations. Int J Technol Assess Health Care. 2022;38(1):e13. CrossRef | PubMed
- 19. Institute for Health Metrics and Evaluation. GBD Results Tool. Washington: IHME; 2020 [cited 2023 May 11]. Available from: www.healthdata.org/data-visualization/gbd-results
- 20. Barendregt J, Van Oortmarssen GJ, Vos T, Murray CJL. A generic model for the assessment of disease epidemiology: the computational basis of DisMod II. Popul Health Metr. 2003;1:4–8. CrossRef | PubMed
- 21. Murray CJL, Aravkin AY, Zheng P, Abbafati C, Abbas KM, Abbassi-Kangevari M, et al. Global burden of 87 risk factors in 204 countries and territories, 1990–2019: a systematic analysis for the Global Burden of Disease Study 2019. Lancet. 2020;396(10258):1223–49. CrossRef | PubMed
- 22. Royal College of Physicians. Hiding in plain sight: treating tobacco dependency in the NHS. London: 2018 [cited 2023 May 30]. Available from: www.rcplondon.ac.uk/projects/outputs/hiding-plain-sight-treating-tobacco-dependency-nhs h
- 23. Quit Victoria. 2013–14 Victorian Quitline evaluation. Melbourne, Victoria, 2016. Available from authors.
- 24. Salomon JA, Vos T, Hogan DR, Gagnon M, Naghavi M, Mokdad A, et al. Common values in assessing health outcomes from disease and injury: disability weights measurement study for the Global Burden of Disease Study 2010. Lancet. 2012;380(9859):2129–43. CrossRef | PubMed
- 25. Neumann PJ, Sanders GD, Russell LB, Siegel JE, Ganiats TG. Cost-effectiveness in health and medicine. Second edition. ed. UK: Oxford University Press; 2017.
- 26. Australian Bureau of Statistics. Survey of income and housing, Australia 2017–18. Canberra: ABS, 2019 [cited 2023 May 11]. Available from: www.abs.gov.au/ausstats/[email protected]/mf/6553.0#
- 27. Australian Bureau of Statistics. Data from: National Health Survey 2014–15. Canberra: ABS, 2021 [cited 2023 May 11]. Available from: www.abs.gov.au/AUSSTATS/[email protected]/DetailsPage/4364.0.55.0012014-15
- 28. Halpern E, Weinstein MC, Hunink MGM, Gazelle S. Representing both first- and second-order uncertainties by Monte Carlo simulation for groups of patients. Medical Decision Making. 2000;20:314–22. CrossRef | PubMed
- 29. Nghiem N, Cleghorn CL, Leung W, Nair N, van der Deen FS, Blakely T, et al. A national quitline service and its promotion in the mass media: modelling the health gain, health equity and cost–utility. TobControl. 2017;27(4):434–41. CrossRef | PubMed
- 30. Blakely T, Cobiac LJ, Cleghorn CL, Pearson AL, van der Deen FS, Kvizhinadze G, et al. Health, health inequality, and costiImpacts of annual increases in tobacco tax: multistate life table modeling in New Zealand. PLoS Med. 2015;12(7):e1001856. CrossRef | PubMed