Abstract
Objectives: To describe blood lead levels (BLLs) and their distribution among children in Broken Hill, New South Wales (NSW), at each of the scheduled testing points aligned with childhood immunisation and to determine how BLLs change over time for individual children. These data can inform action to prevent future lead exposure in Broken Hill children.
Study type: Retrospective longitudinal study.
Methods: Data were extracted from the Lead Management Program ACCESS database on children born between 2009 and 2015 and living in Broken Hill. BLLs were calculated using capillary blood collected via finger prick, classified according to specific blood lead thresholds and grouped according to the testing schedule. A subset of children tested at each of the first three annual testing points provided data to determine the blood lead trajectories for individual Broken Hill children. Data were analysed using SPSS and ArcGIS.
Results: At the first test at 12 months, around half the children recorded a BLL of <5 µg/dL, one in three had a BLL of 5–9 µg/dL and one in five had a BLL of ≥10 µg/dL. A similar pattern was observed for subsequent test points at 18 months, 2 years, 3 years and 4 years. Of the 336 children who had results recorded at each of the 12-month, 2-year and 3-year test points, BLLs in around one-third remained below the recommended threshold of 5 µg/dL. Another one-third of these children had at least one test result ≥10 µg/dL, and the BLL in the remainder did not exceed 5–9 µg/dL at any of the test points. The geospatial distribution of children with very high BLLs shows clustering of these children in some localities, as well as their widespread distribution throughout Broken Hill.
Conclusions: It should be possible to keep BLLs below 5 µg/dL for the majority of young children in Broken Hill throughout their preschool years. This could be achieved by an integrated prevention strategy that includes population-level interventions such as targeted zonal remediation for high-risk areas and early intervention for individuals during the first 12 months and beyond, particularly for those who may not benefit directly from targeted zonal remediation. Routinely collected data could be used to guide the development, and monitor the effectiveness, of these interventions.
Full text
Introduction
Lead, silver and zinc mining have been continuous in the town of Broken Hill, in far western New South Wales (NSW), since 1884. As understanding of the detrimental health effects of lead exposure in children and the blood lead level (BLL) at which they occur has grown, the BLL guideline for action has been progressively revised down since the 1960s. Recent evidence has accumulated that BLLs <10 µg/dL have measurable health impacts and that there may be no safe level of lead exposure in young children.1,2 In response, several countries, including Australia, have reduced BLL thresholds for action to 5 μg/dL or lower.1-4
BLLs ≥5 µg/dL are endemic among young children in Broken Hill, because of the high risk of lead exposure in the community resulting from lead mining. Sources of lead include the legacy of past smelting and mining, and the resultant accumulation of lead dust in houses and soil; lead paint; and the ongoing impact of current mining operations. BLLs have greatly improved for all age groups and all areas of the town after more than two decades of lead abatement efforts, including public education, case finding, home remediation and remediation of public lands.5,6 However, since 2009, 41–61% of the children tested annually have had BLLs of 5 µg/dL and above6, equating to 400–597 children with elevated lead levels. In 2015, the NSW Government provided $13 million for the 5-year Broken Hill Environmental Lead Program to further reduce lead exposure in the Broken Hill community.7
With the historical focus being on reducing elevated BLLs in Broken Hill5,8,9, less attention has been given to factors associated with children’s BLLs remaining below 5 µg/dL. Currently, it is not known how many children live in Broken Hill without developing BLLs ≥5 µg/dL and the implications of this for primary prevention. Modelling suggests that an average soil lead level of <150 mg/kg would be necessary for 80% of Broken Hill children to have BLLs <5 µg/dL.10 Soil lead levels exceed 300 mg/kg across most of the residential areas in Broken Hill and exceed 1000 mg/kg in areas close to the mines.10,11
This paper reports on BLLs and their distribution among young children at each of the scheduled testing points aligned with childhood immunisation, and determines how BLLs trend over time for individual children. These novel calculations can be used to inform the development of key intervention strategies that could lead to a further sustained reduction in BLLs, such as targeted zonal remediation in areas with high soil lead concentrations12-16, and selected abatement of residential and other sites for individual children who live outside these zones. Zonal remediation includes removing and/or capping contaminated soils, on both public and private property, and removing lead paint and other potential sources of lead exposure (such as indoor dust) from homes.
Methods
We conducted a retrospective longitudinal study of children born between 1 January 2009 and 31 December 2015 who had at least one blood lead test recorded on the Lead Management Program ACCESS database and lived in Broken Hill at the time of the test.
Data were extracted from the database on all eligible children who had blood lead tests between 1 October 2009 and 31 December 2016. Data items included unique numerical identifier, address (used to code for location and change of residence between blood lead tests), birth date, sex, test date and blood lead result. BLLs were classified according to specific thresholds of <5 µg/dL, 5–9 µg/dL, 10–14 µg/dL and ≥15 µg/dL.
Blood lead testing was conducted using capillary blood collected via finger prick.17,18 A confirmatory venous blood test was offered for children with BLLs ≥10 µg/dL. Not all parents gave permission for the confirmatory test, particularly for children with BLLs in the 10–14 µg/dL range. For this study, the results of the venous tests were used where they were available. The risk of contamination of the sample from lead on the skin (leading to overestimation of the BLL) was minimised by using a standardised procedure for meticulous skin cleaning of the finger and a no-touch technique. Blood test results were grouped according to the testing schedule (12 months, 18 months, 2 years, 3 years and 4 years). We examined the distribution of age at testing for all children to determine the window for each scheduled test, to optimise the number of children included in the analysis. When more than one test was recorded during the testing window, the first test was used for the analysis. Residential addresses were grouped into five risk areas – 1 (highest) to 5 (lowest) – based on lead levels in soil, indoor dust and BLLs as described in previous papers.8,9
Longitudinal data were obtained from a subset of children who were screened at each of the first three annual testing points in the study period. These data were analysed to determine the BLL trajectories for individual Broken Hill children. Five categories were used to reflect how BLLs tracked over time:
1) All three annual tests <5 µg/dL (i.e. below the current National Health and Medical Research Council guideline for action1)
2) Two tests <5 µg/dL and one test 5–9 µg/dL
3) Two or more tests 5–9 µg/dL, no test ≥10 µg/dL
4) At least one of the three tests peaking at 10–14 µg/dL
5) At least one test ≥15 µg/dL.
The number of eligible registrants for each scheduled test point and for the longitudinal analysis was determined by the child’s age at the end of the study period.
Data analysis was conducted using SPSS (Chicago: IBM; Version 24). Chi-square statistics were used to compare categorical data (two-tailed; p < 0.05), and 95% confidence intervals were calculated for proportions using the normal approximation method. Geospatial analysis was undertaken using the ArcGIS (Brisbane: Esri Australia; Version 10.7) and Kernel Density Estimation function to produce density maps showing where children with different BLL trajectories were concentrated, based on longitudinal data for children born 2009–2013.
Ethics approval for the study was obtained from the Greater Western Human Research Ethics Committee (Project LNR/16/GWAHS/155) and ratified by the University of Sydney.
Results
A total of 1865 Broken Hill children born between 2009 and 2015 were registered on the Lead Management Program database (Table 1).
The proportion of children who had a blood lead test at 12 months rose from 36% of those born in 2009 to 73% of those born in 2014 and 2015. Approximately half the children tested at 12 months already had a BLL ≥5 µg/dL (Table 1). This proportion was substantially less in 2009 and 2010 (37% and 33%, respectively), before testing rates improved as a result of alignment of lead testing with childhood immunisation in 2010–11.
At this 12-month test, around half the children recorded a BLL <5 ug/dL, one in three had a BLL 5–9 µg/dL, and one in five had a BLL ≥10 µg/dL.
Table 1. Blood lead levels at 12-month test for Broken Hill children born 2009–2015
| Year of birth | Registrants n | n (%) | Total | |||
| <5 µg/dL | 5–9 µg/dL | 10–14 µg/dL | 15+ µg/dL | |||
| 2009 | 296 | 69 (63) | 30 (28) | 8 (07) | 2 (02) | 109 |
| 2010 | 286 | 89 (67) | 33 (25) | 9 (07) | 2 (02) | 133 |
| 2011 | 242 | 73 (53) | 47 (34) | 14 (10) | 5 (04) | 139 |
| 2012 | 290 | 81 (43) | 74 (39) | 22 (12) | 13 (07) | 190 |
| 2013 | 283 | 108 (55) | 50 (26) | 29 (15) | 9 (05) | 196 |
| 2014 | 242 | 94 (53) | 61 (34) | 12 (07) | 12 (07) | 179 |
| 2015 | 226 | 77 (47) | 53 (32) | 24 (15) | 11 (06) | 165 |
| Total | 1865 | 591 (53) | 348 (31) | 118 (11) | 54 (05) | 1111 |
The distribution of children by BLL category was similar across each of the scheduled testing points (Table 2). The proportion of eligible registrants who had a blood lead test at each test point was 12 months, 60%; 18 months, 51%; 2 years, 44%; 3 years, 44%; and 4 years, 60%.
Table 2. Blood lead levels for Broken Hill children at scheduled test points, 2010–2016
| Test point |
n (%) |
Total | |||
| <5 µg/dL | 5–9 µg/dL | 10–14 µg/dL | 15+ µg/dL | ||
| 12 months | 591 (53) | 348 (31) | 118 (11) | 54 (5) | 1111 |
| 18 months | 449 (51) | 280 (31) | 103 (12) | 57 (6) | 889 |
| 2 years | 345 (48) | 235 (33) | 78 (11) | 56 (8) | 714 |
| 3 years | 273 (45) | 193 (31) | 82 (13) | 66 (11) | 614 |
| 4 years | 316 (47) | 230 (34) | 85 (13) | 44 (7) | 675 |
Longitudinal analysis
Longitudinal data were obtained for 335 children born between 2009 and 2013, and one child born in 2014, who had results recorded at each of the 12-month, 2-year and 3-year test points.
Approximately one-third of children had results that remained below 5 µg/dL at each test (0.30; 95% confidence interval [CI] 0.25, 0.35). Another one-third had at least one test result ≥10 µg/dL, and the remainder did not exceed 5–9 µg/dL at any of the annual test points (Table 3).
Table 3. Association between locality and blood lead levels, based on results recorded at scheduled test points at 12 months, 2 years and 3 years
| Blood lead result | Zone 1 | Zone 2 | Zone 3 | Zone 4 | Zone 5 | Total (%) |
| Children n | 31 | 24 | 30 | 82 | 169 | 336 |
| Lower levelsa | ||||||
| Every test <5 µg/dL | 3 | 4 | 6 | 25 | 62 | 100 (30) |
| 2 tests <5 µg/dL | 1 | 3 | 9 | 16 | 32 | 61 (18) |
| Subtotal n (%) | 4 (13) | 7 (29) | 15 (50) | 41 (50) | 94 (57) | 161 (48) |
| Persistent high levels | ||||||
| 2+ tests 5–9 µg/dL and all tests <10 µg/dL n (%) |
7 (23)
|
4 (27) | 7 (22) | 16 (19) | 33 (18) | 67 (20) |
| Very high levelsb | ||||||
| 1+ test 10–14 µg/dL | 11 | 4 | 5 | 16 | 30 | 66 (20) |
| 1+ test ≥15 µg/dL | 9 | 9 | 3 | 9 | 12 | 42 (13) |
| Subtotal n (%) | 20 (64) | 13 (54) | 8 (27) | 25 (30) | 42 (25) | 108 (32) |
a Lower levels are defined as at least two of three annual blood lead test results not exceeding 5 µg/dL, and no test ≥10 µg/dL
b Very high levels (≥10 µg/dL) are defined as at least one of the three annual test results peaking at 10–14 µg/dL, or higher
Note: Soil lead hazard for zones: 1 = highest; 5 = lowest
The risk of a child having at least one test ≥10 µg/dL varied by locality (χ24df = 24.87; p = 0.0001), ranging from a probability of 0.65 (95% CI 0.48, 0.81) for the area with the highest soil lead hazard (zone 1) to 0.25 (95% CI 0.18, 0.31) for the area with the lowest soil lead hazard (zone 5) (risk ratio = 2.6; Table 3). Nonetheless, most children (69%) with a very high BLL (1+ tests ≥10 µg/dL) resided outside the higher lead hazard zones (zones 1 and 2). Furthermore, some children in all localities were able to sustain lower BLLs (two of three annual tests <5 µg/dL and no result ≥10 µg/dL) – ranging from 1 in 10 children (13%; 95% CI 4, 30) in the highest lead hazard area (zone 1) to about half of children (53%; 95% CI 48, 59) across the lower hazard zones (zones 3, 4 and 5).
The geospatial distribution of Broken Hill children with at least one test result of ≥10 µg/dL shows the clustering of these children adjacent to, and mostly south of, the Line of Lode (the ore body that bisects the town), in the highest soil lead hazard zones and one locality to the north outside the highest soil hazard areas (Figure 1). Children whose BLLs tracked lower (i.e. remained below 10 µg/dL) also resided throughout the community, but were clustered in areas of lower soil lead hazard some distance from the Line of Lode, especially to the north.
Figure 1. Geospatial maps of Broken Hill showing where children with a low blood lead trajectory or very high blood lead levels were clustered, based on longitudinal data from children born 2009–2013 (click to enlarge)
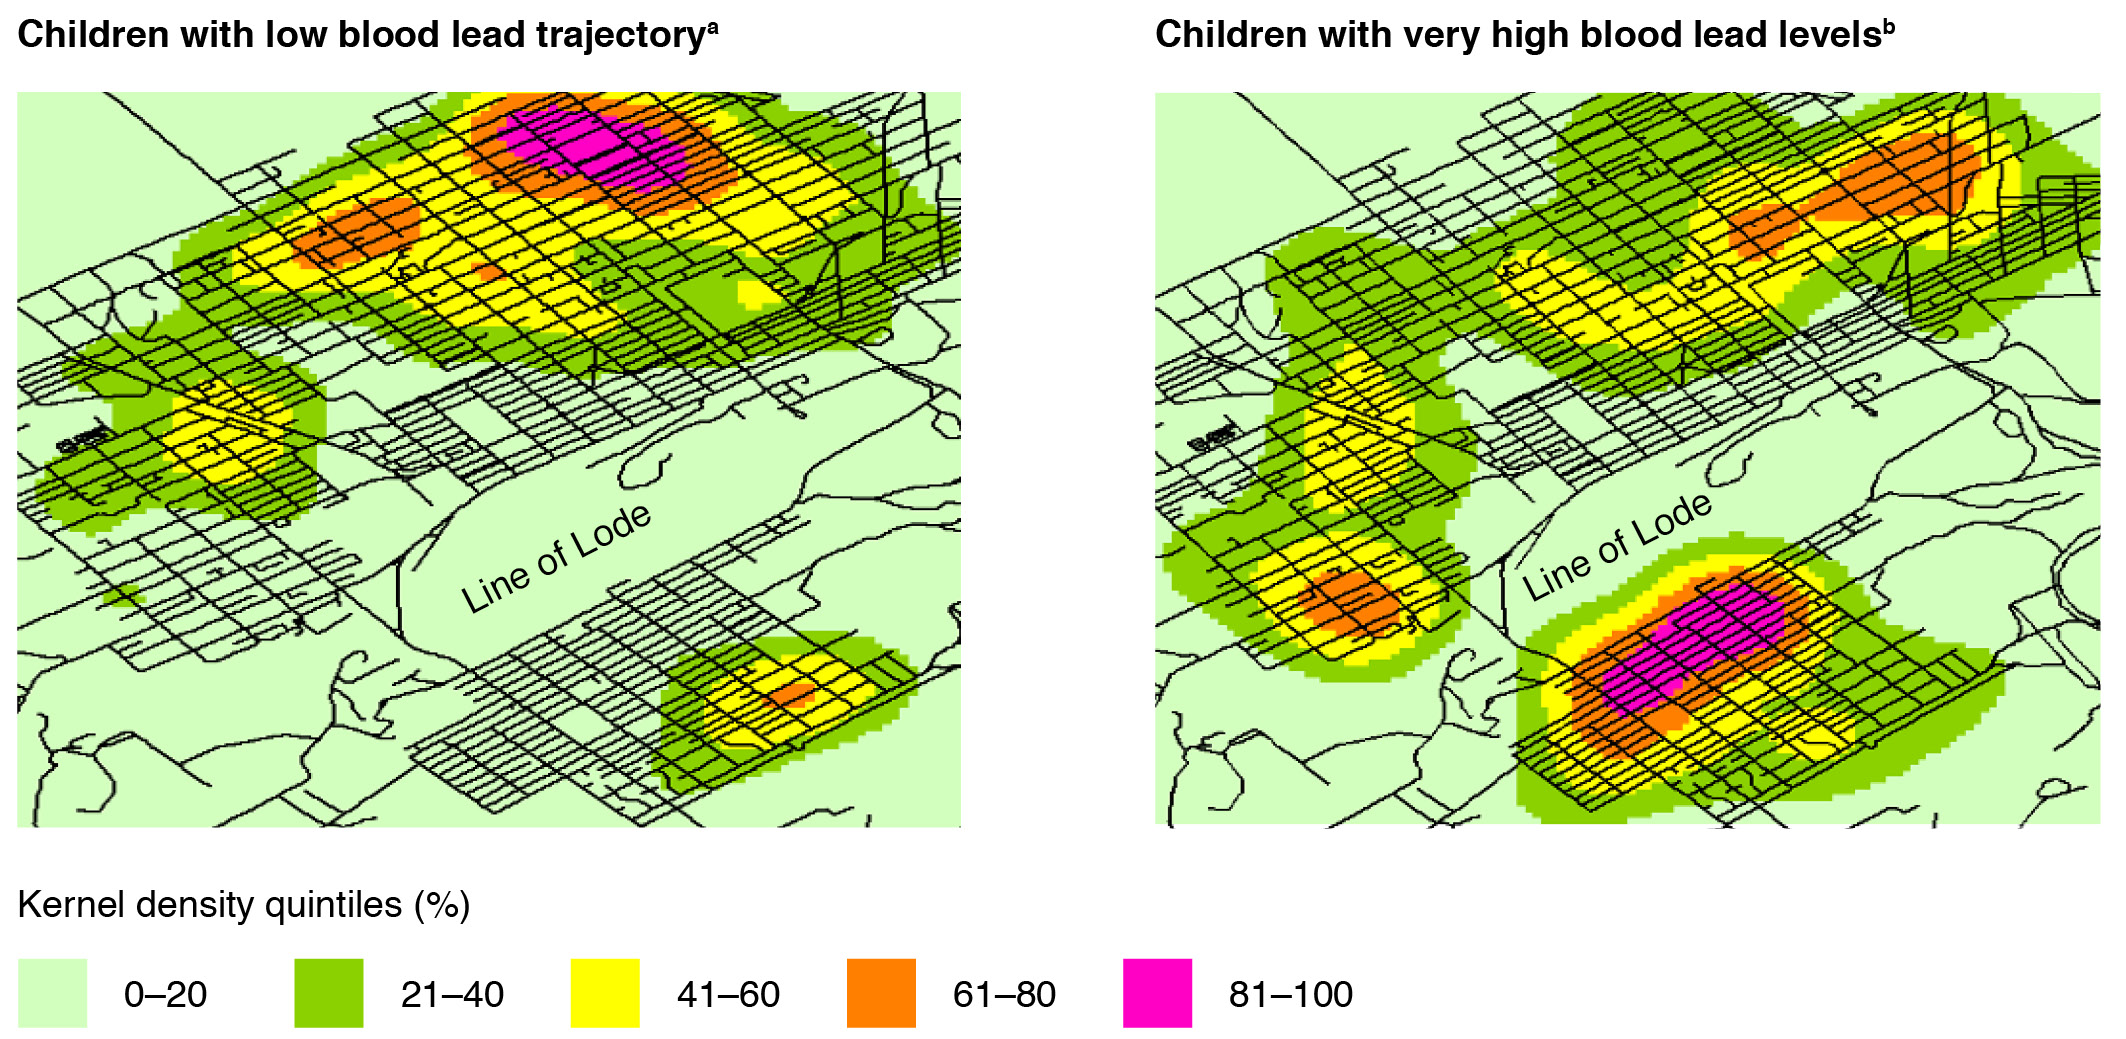
a Low blood lead trajectory: at least two of three annual blood lead test results (at 12 months, 2 years and 3 years) <5 µg/dL, with no test ≥10 µg/dL
b Very high blood lead levels: blood lead level ≥10 µg/dL recorded in at least one of the three annual tests
Discussion
This is the first lead study in Broken Hill to generate longitudinal data on individuals to estimate how many children live carefully with lead, based on a child recording a BLL <5 µg/dL at each of the 12-month, 2-year and 3-year test points. It was encouraging to see that 30% of children in Broken Hill with longitudinal data returned BLL results below that threshold, and a further 18% exceeded the level at only one test point within the range 5–9 µg/dL, during their first 3 years. Although these children resided throughout the Broken Hill community, they were clustered in areas of lower soil lead hazard some distance from the Line of Lode, especially to the north. These findings are significant in considering options to further reduce BLLs of Broken Hill children following completion of the NSW Government’s 5-year funding of the Broken Hill Lead Management Program.
The study findings can inform the development of primary prevention strategies for the next stage of the Lead Management Program, such as the use of targeted zonal remediation, which is an effective strategy for reducing BLLs in children.13-16 The study showed that, at an individual level, children who lived in the highest-risk zone close to the Line of Lode were 2.6 times more likely to develop very high BLLs than those living farthest away from the ore body. Nonetheless, because only a small proportion of children live within the highest-risk zones, at a population level, most (69%) children with very high BLLs live elsewhere in the community. Remediation would therefore need to be extended beyond the higher-risk zones for greater effect. Geospatial mapping provided further guidance on specific localities that might be suitable for targeted zonal remediation, both within the high soil lead hazard zones and elsewhere, where clusters of children with very high BLLs reside.
The study also highlights the significance of early exposure and the need for a primary prevention focus for individuals during the first 12 months of life to keep BLLs down, particularly for children who would not benefit directly from targeted zonal remediation. An additional blood lead test for infants at the 6-month immunisation appointment started in 2018 to monitor trends in early exposure to lead and as a potential trigger for early intervention for infants at increased risk of an elevated BLL by 12 months. To make a positive contribution, early intervention strategies would need to identify and mitigate the effects of specific sources and pathways of exposure for individual children. This would extend the remediation effort to include children who reside outside the high-risk zones and other areas deemed suitable for targeted zonal remediation.
The inclusion of clinical indicators that report on the proportion of children with BLLs below a threshold of 5 µg/dL at each test point and during the first 3 years of life could also provide a useful measure of program effects over time.
Limitations
The number of registrations on the lead database was substantially higher than expected from the Australian Bureau of Statistics Census19, based on counts of 880 and 790 children aged 1–4 years resident in Broken Hill in 2011 and 2016, respectively (220 to 200 per birth cohort). This probably reflects migration of young families in and out of the town, and resulted in an underestimation of screening rates. The potential for selection bias is noted in the analysis of trends in BLLs for individual children during their first 3 years, based on data from 43% of eligible children who had a 12-month test.
Conclusions
It should be possible to keep BLLs below 5 µg/dL for the majority of young children in Broken Hill throughout their preschool years within the next 3–5 years. This could be achieved by an integrated prevention strategy that includes targeted zonal remediation for higher-risk soil lead hazard areas and early intervention for individuals during the first 12 months and beyond, particularly for those who may not benefit directly from targeted zonal remediation. Routinely collected data could be used to guide the development, and monitor the effectiveness, of these interventions.
Acknowledgements
The study benefited from input from staff at Child and Family Health, Far West Local Health District, Maari Ma Health Aboriginal Corporation and the Health Intelligence Unit, Western NSW and Far West Local Health Districts. Guddu Kaur provided advice on the design of the study and arranged access to data.
Funding was provided by the Broken Hill Environmental Lead Program, NSW Environment Protection Authority. The Broken Hill University Department of Rural Health is funded by the Australian Government Department of Health.
Peer review and provenance
Externally peer reviewed, not commissioned.
Copyright:

© 2021 Lyle et al. This work is licensed under a Creative Commons Attribution-NonCommercial-ShareAlike 4.0 International Licence, which allows others to redistribute, adapt and share this work non-commercially provided they attribute the work and any adapted version of it is distributed under the same Creative Commons licence terms.
References
- 1. National Health and Medical Research Council. NHMRC information paper: evidence on the effects of lead on human health. Canberra: NHMRC; 2015 [cited 2021 Jan 25]. Available from: www.nhmrc.gov.au/about-us/publications/evidence-effects-lead-human-health
- 2. Wilhelm M, Heinzow B, Angerer J, Schulz C. Reassessment of critical lead effects by the German Human Biomonitoring Commission results in suspension of the human biomonitoring values (HBM I and HBM II) for lead in blood of children and adults. Int J Hyg Environ Health. 2010;213:265–9. CrossRef | PubMed
- 3. Health Canada. Final human health state of the science report on lead. Canada: Government of Canada; 2013 [cited 2021 Jan 25]. Available from: www.hc-sc.gc.ca/ewh-semt/pubs/contaminants/dhhssrl-rpecscepsh/index-eng.php
- 4. Centers for Disease Control and Prevention, Advisory Committee on Childhood Lead Poisoning Prevention. Low level lead exposure harms children: a renewed call for primary prevention. Atlanta, GA: CDC; 2012 [cited 2021 Jan 25]. Available from: www.cdc.gov/nceh/lead/docs/final_document_030712.pdf
- 5. Boreland F, Lesjak M, Lyle D. Managing environmental lead in Broken Hill: a public health success. NSW Public Health Bull. 2008:19:174–9. CrossRef | PubMed
- 6. Leadsmart. Lead report 2016: Broken Hill children less than 5 years old, revised (2016 Census). Orange, NSW: NSW Ministry of Health; 2017 [cited 2018 Dec 21]. Available from: leadsmart.nsw.gov.au/wp-content/uploads/2017/12/2016-Lead-Report-Revised-Census-2016.pdf
- 7. Minister for Natural Resources Lands and Water, Minister for Western NSW. NSW Government commits more than $13 million to reduce lead levels at Broken Hill. Sydney: NSW Government; 2015. [cited 2021 Jan 25]. Available from: www.epa.nsw.gov.au/~/media/EPA/Corporate%20Site/resources/MinMedia/EPAMin150213.ashx
- 8. Boreland F, Lyle DM, Wlodarczyk J, Balding WA. Lead dust in Broken Hill homes: relationship between house dust and children’s blood lead levels. Environmental Health. 2006;6:15–24.
- 9. Phillips A. Trends in and factors for elevated blood lead concentration in Broken Hill pre-school children in the period 1991 to 1993. Newcastle, NSW: University of Newcastle; 1998. Available from: https://nova.newcastle.edu.au/vital/access/manager/Repository/uon:22478
- 10. Yang K,Cattle SR. Bioaccessibility of lead in urban soil of Broken Hill, Australia: a study based on in vitro digestion and the IEUBK model. Sci Total Environ. 2015;538:922–33. CrossRef | PubMed
- 11. Boreland F, Lyle D, Wlodarczyk J, Wlodarczyk J, Balding WA, Reddan S. Lead dust in Broken Hill homes—a potential hazard for young children? Aust N Z J Public Health. 2002;26:203–7. CrossRef | PubMed
- 12. Boreland F,Lyle D. Putting the genie back in the bottle: protecting children from lead in the 21st century. A report from the field. Public Health Res Pract. 2014;25(1):e2511403. CrossRef | PubMed
- 13. Lanphear B, Dietrich K,Berger O. Prevention of lead toxicity in US children. Ambul Pediatr. 2003;3:27–36. CrossRef
- 14. von Lindern I, Spalinger S, Bero B, Petrosyan V, von Braun MC. The influence of soil remediation on lead in house dust. Sci Total Environ. 2003;303:59–78. CrossRef | PubMed
- 15. von Lindern I, Spalinger S, Petroysan V, von Braun M. Assessing remedial effectiveness through the blood lead:soil/dust lead relationship at the Bunker Hill Superfund Site in the Silver Valley of Idaho. Sci Total Environ. 2003;303:139–70. CrossRef | PubMed
- 16. Mielke H, Covington T, Mielke P, Mielke Jr PW, Wolman FJ, Powell ET, Gonzales CR. Soil intervention as a strategy for lead exposure prevention: the New Orleans lead-safe childcare playground project. Environ Pollut. 2011;159:2071–7. CrossRef | PubMed
- 17. Kardamanidis K, Lyle D, Boreland F. Environmental lead management in Broken Hill: addressing decreasing blood lead screening rates. NSW Public Health Bull. 2008;19:180–2. CrossRef | PubMed
- 18. Boreland F, Lyle D, Brown A, Perkins D. Effectiveness of introducing point of care capillary testing and linking screening with routine appointments for increasing blood lead screening rates of young children: a before-after study. Arch Public Health. 2015;73:60. CrossRef | PubMed
- 19. Australian Bureau of Statistics. QuickStats. Canberra: ABS; 2016 [cited 2021 Jan 25]. Available from: www.abs.gov.au/websitedbs/D3310114.nsf/Home/2016%20QuickStats