Abstract
Background: Agriculture is one of the most hazardous industries in Australia. The Australian Centre for Agricultural Health and Safety is the only agency that records all non-intentional injury-related events (work and nonwork) on Australian farms.
Materials and methods: Drawing on records from the National Coronial Information System, data for New South Wales (NSW), Australia, were analysed to assess cases in the 2001–2015 period. Each case was reviewed in accordance with the Farm Injury Optimal Dataset to ascertain gender, age, work relatedness and causal agents. The location of each incident was also mapped by Statistical Area Level 4. Denominator data on the number of agricultural establishments in each area and the number of workers involved in agriculture across all of NSW were sourced from the Australian Bureau of Statistics (ABS). Two-piece linear regressions using 2007 as the change point were completed to ascertain trends for the work-related cases and all deaths (work and nonwork). Differences in rates of all deaths by regions were assessed using Poisson regression models.
Results: Results indicate no change in the rate of work-related deaths per 100 000 workers over the 15-year period (mean 17.3). Although there was a statistically significant reduction in all deaths (work and nonwork) per 10 000 farms through to 2007, the rate has remained stable since this time. There was no significant variation in the all-deaths rate (work and nonwork) between any of the geographic areas.
Study limitations included estimations based on ABS data for the distribution of farms, the lack of data by statistical area on agricultural worker numbers and a case closure rate of 87%.
Lessons learnt: There has been no improvement in work-related fatality rates in the sector in NSW for at least 15 years, and similarly no improvement in the all-injury fatality rate (work and nonwork) since 2007. Data in this study can be used to strengthen investment and revitalise the adoption of evidence based approaches that address relevant issues.
Full text
Introduction
The high risk of injury associated with agricultural production is well recognised1, and this is also reflected in the priorities of the state workplace health and safety authority in New South Wales, Australia, (SafeWork NSW).2 Agricultural production in NSW accounts for about 14% of arable land use in Australia and approximately 25% of the national agricultural output.3
Although national data on the extent of farm-related fatalities are available, less is known about the specific patterns within NSW and any regional variations.4 This paper describes the extent, nature and patterns of non-intentional farm-related injury fatalities over the 2001–2015 period in NSW. Ethics approval was from the Department of Justice Human Research Ethics Committee (approval number CF/14/1161).
Method
Non-intentional farm injury fatalities were defined as those occurring to farmers and people working in agricultural production, as well as to bystanders to farm work being undertaken, and others in the course of leisure but harmed by hazards used in farm production. Data were extracted from the National Coronial Information System (NCIS) for the period 2001 to 2015. Incident data on gender, age, work relatedness and causal agents such as tractors, quads (quad bikes) and horses were recorded, and descriptive data were compiled. Further details on the NCIS, the extraction process and coding of variables, including the Farm Injury Optimal Dataset, are available elsewhere.4-6
To approximate the geographic spread of non-intentional farm fatalities in NSW, the postcode location for each incident was recoded based on the Australian Statistical Geography Standard Volume 1 Statistical Area Level 4 (SA4).7 An exception was cases in the 14 SA4 areas making up the Sydney metropolitan area, which were classified as Greater Sydney for aggregation purposes. The number of agricultural businesses (farms) in each SA4 were derived from Australian Bureau of Statistics (ABS) data for 2010–11 and used as a proxy for the distribution of farms over the period.8 Denominator data on the number of people working in the agricultural sector across NSW for each year were also derived from the ABS.9 These data were used to determine crude fatality rates averaged over the 15-year period for work-related cases per 100 000 workers. In addition, rates per 10 000 farms for all on-farm fatalities (work and nonwork) were calculated with 95% confidence intervals.
To assess trends over time, separate two-piece linear regressions were performed with the median year 2007 as the change point for both the work-related (per 100 000 workers) and all on-farm (per 10 000 farms) incidents. Poisson regression models with a log link were used to assess differences in rates of deaths across regions in NSW. These used numbers of deaths with the number of farms (log transformed) as the offset. Both the likelihood ratio test (LRT) and the Wald chi-square test were used in assessing the association with region. The LRT indicates if the model including region is an improvement on an intercept-only model, whereas the Wald chi-square test checks that all coefficients for region in the regression model are zero. For these analyses, regions were grouped into six geographic and demographic clusters: 1) Central Coast/Greater Sydney/Illawarra; 2) Southern, Capital Region; 3) Coffs Harbour–Grafton, Mid North Coast, Richmond–Tweed; 4) Hunter Valley (excluding Newcastle), Central West; 5) Far West and Orana, North West; and 6) Murray, Riverina. The Newcastle–Lake Macquarie area was excluded from the modelling because there were no recorded fatalities. All analyses were conducted using IBM SPSS Version 22, with statistical significance set at p < 0.05.
Results
A total of 371 fatality cases were identified in NSW, with 87% closed (finalised) in the coronial system. These incidents represented 30.2% of all cases nationally (n = 1226). The majority of cases involved males (87.8%), with deaths most frequent in those aged 60–74 years (22.4%) and 45–59 years (20.3%). Those older than 60 years of age were involved in 35.9% of all fatal incidents, and children younger than 15 years of age accounted for 13.2% of cases. Of the 367 cases where the context was known, 56.8% were work related.
The leading agents were tractors (n = 51) and quads (n = 46). Farm utes were also frequently involved in incidents (n = 28), as were a range of other types of farm machinery, including earthmoving and harvesting equipment (n = 32). The tractor and quad cases were dominated by those aged 50 years and older, comprising 80% of tractor (n = 41) and 65% of quad (n = 30) cases. Children younger than 15 years were involved in 4% of tractor and 13% of quad incidents. Of the 18 cases involving drowning, 16 involved children, with 13 being 5 years of age or younger. Typically, agents involved dams, pools and creeks/rivers.
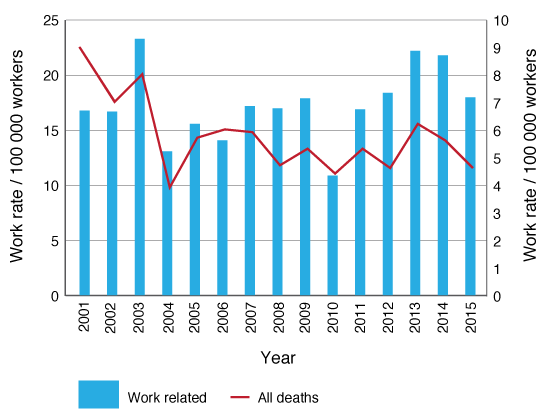
The rates for both work-related cases and all cases fluctuated over the period (Figure 1). For work-related incidents, the regression illustrated no significant variation before the change point in 2007 (p = 0.338; R2 0.209) or after 2007 (p = 0.1). The mean number of work-related fatal incidents per year was 14, and the mean rate was constant at 17.3 per 100 000 workers (standard deviation [SD] 3.3).
The annual mean number of all on-farm fatal injuries was 25 (work n = 14; nonwork n = 11), with the rate over the period being 5.8 per 10 000 agricultural establishments (SD 1.4). The piecewise linear model indicated a significant negative trajectory for 2001 to 2007, with a decline of 0.511 (standard error [SE] 0.163; p = 0.009) annually, followed by a constant rate of 5.09 (SD 0.62).
Figure 1. Rates of farm work-related incidents per 100 000 workers and rates of all non-intentional farm deaths (work and nonwork) per 10 000 farms in NSW, 2001–2015 (click to enlarge)
Geographically, the greatest number of cases was in North West NSW (approaching 4 cases per year), closely followed by the Central West (Table 1). There was no difference in rates between combined regions for the LRT model (2 8.116, df 5, p = 0.150); however, all regions’ rates were significantly lower than the Greater Sydney/Illawarra/Central Coast cluster for the Wald test (2 72.392, df 5, p < 0.001).
Table 1. Number of non-intentional farm injury deaths, rates of all non-intentional farm deaths (work and non-work) per 10 000 farms and leading agents of fatality by Statistical Area Level 4, 2001–2015
CI = confidence interval
a Case numbers and leading agents only reported where cases >5
When the agents of injury were assessed in relation to each SA4, the relative contribution to the fatality profile of some specific agents such as tractors was evident in the Mid North Coast, Richmond–Tweed, Greater Sydney and Riverina. Similarly, quads imposed a notable burden in the North West and Far West.
Discussion
These data indicate that there has been no significant improvement in the work-related fatality rate for agriculture in NSW over the past 15 years, with a constant rate of 17.3 per 100 000 workers. Although there was a significant reduction in the all-fatality rate (work and nonwork) through to 2007, this decline has also stabilised since this time.
A sentinel study of work-related fatalities in NSW (1989–1992) reported a rate of 25.1 per 100 000 workers, with further data identifying the all-cause rate (work and nonwork) as 9.8 per 10 000 farms.10,11 In comparison to these historical data, the current study illustrates a reduction of some 32% in work-related fatalities and 41% in all-cause fatality rates from this period. Despite these positive developments, a significant concern is the levelling off in both work and all-cause fatality rates. Further, the agricultural work-related fatality rate in NSW remains almost 12 times higher than the 2014 all-industry rate for NSW (1.46 per 100 000 workers), suggesting that significant improvements can be made.12
There were no significant differences in rates of all non-intentional farm deaths (work and nonwork) per 10 000 farms across NSW based on location of occurrence (SA4). Although it was identified that rates in the predominantly urban areas were somewhat elevated, this was not significant and may be an artifact of the comparatively low number of farms and relatively small case numbers in these areas.
The dominance of older males, involvement of children and major agents of injury fatalities in the NSW cases (tractors, quads, farm machinery, farm utes and bodies of water) are consistent with patterns nationally.4 Indeed, the finding that just under 60% of cases were work related highlights the significant gaps in the official SafeWork NSW data, which provide only a partial picture of the risks and consequences associated with agriculture. Agriculture is somewhat unique in that the farm is frequently the family residence, and the distinction between work and recreation is often blurred. Consequently, this exposes both children and visitors to risks that they would otherwise not be exposed to (i.e. tractors, machinery, quads and water bodies).
There is some geographical variation in the prevalence of the main agents responsible for fatalities across NSW, notably tractors and quads. With the geographic areas used being broadly comparable to the NSW Local Health District boundaries, this may provide some additional focus for locally relevant preventive activities.
This study is limited by the sole focus on fatal cases, because it is known that agriculture also has a poor record in terms of nonfatal compensable injury.2 The patterns and trends associated with these compensable injuries are likely to differ from those resulting in fatality and require further investigation. Additionally, it was not possible to ascertain the number of people working in agriculture within each SA4, so work-related rates could not be calculated for each area. As an alternative, rates were based solely on the number of agricultural establishments in each area. Finally, not all of the cases were closed by the coroner (87%), so there may be some slight variability in results (particularly for the more recent years of the study) once these cases are finalised.
The lack of continued reductions in non-intentional fatal injury in the agriculture sector in NSW is of serious concern and suggests that alternative approaches are required. Although direct cause and effect cannot be attributed, it may be contended that the removal of injury prevention as a core priority of health services in NSW from about 2009, accompanied by a divestment of resources to support community interventions, has contributed to these results. Despite this, there is significant potential to prevent these incidents.13 However, improved investment is needed to revitalise the adoption of evidence based approaches that address the issue. Data in this study can assist by underpinning this evidence based approach.
Acknowledgements
We thank the staff of the NCIS for assisting with case identification and clarifying case details.
Copyright:

© 2017 Lower et al. This work is licensed under a Creative Commons Attribution-NonCommercial-ShareAlike 4.0 International Licence, which allows others to redistribute, adapt and share this work non-commercially provided they attribute the work and any adapted version of it is distributed under the same Creative Commons licence terms.
References
- 1. Rautiainen R, Lehtola M, Day L, Schonstein E, Suutarinen J, Salminen S. Interventions for preventing injuries in the agricultural industry. Cochrane Database Syst Rev. 2008;(1):CD006398. CrossRef | PubMed
- 2. Safe Work Australia. Work health and safety in the agricultural industry. Canberra: Safe Work Australia; 2016 [cited 2016 Oct 25]. Available from: www.safeworkaustralia.gov.au/system/files/documents/1702/whs-in-the-agricultural-industry.pdf
- 3. NSW Government Trade and Investment. The contribution of primary industries to the NSW economy: key data 2013. Sydney: NSW Government; 2013 [cited 2016 Oct 25]. Available from: www.dpi.nsw.gov.au/__data/assets/pdf_file/0011/463763/Contribution-of-PI-to-the-NSW-economy-2013.pdf
- 4. Lower T, Herde E. Non-intentional farm injury fatalities in Australia, 2003–2006. N S W Public Health Bull. 2012;23(1–2):21–6. CrossRef | PubMed
- 5. Fragar L, Pollock K, Morton C. The changing profile of Australian farm injury deaths. J Occ Health Safety, ANZ. 2008;24(5):425–33.
- 6. Monaghan N, Lower T, Rolfe M. Fatal incidents in Australia’s older farmers (2001–2015). J Agromedicine. 2017;22(2):100–8. CrossRef | PubMed
- 7. Australian Bureau of Statistics. Australian Statistical Geography Standard (ASGS) Volume 1: New South Wales maps. Canberra: ABS; 2011 [cited 2016 Mar 9]. Available from: www.ausstats.abs.gov.au/ausstats/subscriber.nsf/0/B7B9EA9FB45ADB90CA257801000DCE10/$File/1270055001_asgs_2011_nsw_maps.pdf
- 8. Australian Bureau of Statistics. Agricultural commodities, Australia 2010–11: ASGS NSW – all commodities: Table 1 Agricultural commodities, ASGS – State/SA4: New South Wales–2010–11(a). Canberra: ABS; 2012 [cited 2016 Mar 9]. Available from: www.abs.gov.au/AUSSTATS/[email protected]/DetailsPage/7121.02010-11
- 9. Australian Bureau of Statistics. Employed persons (ST E06) by industry (ANZSIC group), state and territory, status in employment and sex, August 1991 onward. Canberra: ABS; 2016 [cited 2016 Mar 9]. Available from: www.abs.gov.au/AUSSTATS/[email protected]/DetailsPage/6291.0.55.003Aug%202015?OpenDocument
- 10. Franklin R, Mitchell R, Driscoll T, Fragar L. Farm-related fatalities in Australia, 1989–1992. Moree: ACAHS, NOHSC and RIRDC; 2000 [cited 2017 Nov 10]. Available from: www.sydney.edu.au/medicine/aghealth/uploaded/Research%20Reports/farm_rel_fatalites_aus_89_92.pdf
- 11. National Occupational Health and Safety Commission. Work-related traumatic fatalities in Australia, 1989 to 1992. Canberra: Commonwealth of Australia; 1998 [cited 2017 Nov 10]. Available from: www.yumpu.com/en/document/view/29401665/work-related-traumatic-fatalities-in-australia-1989-to-1992
- 12. Safe Work Australia. Work-related traumatic injury fatalities, Australia 2014. Canberra: Safe Work Australia; 2015 [cited 2017 Nov 10]. Available from: www.safeworkaustralia.gov.au/system/files/documents/1702/work-related-traumatic-injury-fatalities-australia-2014.pdf
- 13. Lower T, Fragar L, Herde E. Potential for preventing farm injury fatalities in Australia. J Health Safety Env. 2011;27(2):125–37. Article