Abstract
Objectives and importance of study: An increase in hospitalisations for complicated dental decay among Western Australian children, particularly those who are disadvantaged, is well documented. An informed, targeted distribution of limited resources is needed to effectively assist children who are most at risk. This study developed an integrated school-by-school Index of Dental Risk based on known primary risk variables for dental decay, poverty and Indigenous status.
Study type: Population-based research.
Methods: All data were collected from open web-based sources that were freely available, so no ethics approval was required. All data were collected in 2011 from 1112 Western Australian schools. Data included the nationally agreed Socio-Economic Indexes for Areas, and Accessibility/Remoteness Index of Australia.
Results: The Index of Dental Risk was categorised into four risk profiles for each Western Australian school: low (0–4), medium (5–9), medium-high (10–14) and high (15–18). We found that 57% of schools had a medium risk profile or higher (≥5). Nine schools had the highest risk category of 18.
Conclusions: This study is the first to develop a simple Index of Dental Risk that can be applied at the individual school level to efficiently target resources. This evidence based resource allocation has the potential to reduce overall cost burdens of oral health–related pathology in the community.
Full text
Introduction
During the past few decades, the prevalence and incidence of childhood dental caries (decay) in Australia has substantially declined.1 Most now affected are poor and/or disadvantaged children2,3, including Indigenous Australians, because of multifaceted social factors and social determinants.4 This change in disease distribution requires a targeted approach to planning school dental services using community caries risk assessment. Australia is one of the largest countries in the world by geographic area, and the health system must provide care across vast regions. Western Australia is the largest Australian state – it has an area of 2.6 million square kilometres with a population of approximately 2.6 million. Approximately 75% of people live in five disparate urban centres.5
The state government funds the School Dental Service, a state-wide program offering basic school-based care for all school children.6 Despite this extensively funded primary health network, a large number of school children are hospitalised each year for treatment of dental caries, with significant cost burdens to the state.7 The development of an evidence based risk index to direct resources where they are most needed could support effective service planning. Additionally, such an index has the potential to reduce preventable hospitalisations by supporting efficient and targeted early primary intervention.
This study aimed to formulate a customised Index of Dental Risk for all Western Australian schools, based on evidence of low socio-economic and Indigenous Australians suffering the greatest oral disease burdens.4,8,9 This research has the potential to offer a framework for similar risk index development in other locations, nationally and internationally.
Methods
All data were collected from open web-based sources: the Australian Bureau of Statistics (ABS), the Australian Institute of Health and Welfare (AIHW) and the Western Australian Department of Education websites. No ethics approval was required as all data were freely available, de-identified population-level data. No individual-specific data were used.
The ABS produces high-quality data from the Census. This uses a four-principle quality management protocol to eliminate errors and provides guidelines for data users to ensure correct interpretation.10
Population data
All population data were collected from the national 5-yearly Census in 2011. This included Statistical Local Area (SLA) data and Census Collection District (CD)–level population data (including Indigenous proportions). According to the Australian Standard Geographical Classification, the SLA is the base spatial unit applied to gather and distribute statistics other than data collected from the population census. The SLAs include the whole of Australia with no gaps or overlaps.11 The CD is the second smallest geographic area expressed in the Australian Standard Geographical Classification and is designed for the purpose of gathering a census.
School data
School data were collected in 2011 and included kindergarten to year 12 students aged 4 to 17. This included data for 1112 schools from the Western Australian Department of Education in 2011.12 The data included all Western Australian schools except for one school that was unidentifiable. The data included the school address, year-groups taught and number of students (Indigenous and non-Indigenous) at each school. Each school was geocoded (i.e. the longitude and latitude of its street address determined) using Google maps.
Socio-economic data
The socio-economic status of each school was determined using the Socio-Economic Indexes for Areas (SEIFA) established by the ABS.13 Populated areas are ranked by SEIFA to define relative socio-economic advantage and disadvantage. Rankings are arranged into 10 equal bands or deciles. The most disadvantaged 10% of Australians are categorised in decile 1 and the least disadvantaged 10% in decile 10. SEIFA deciles are constructed from the 5-yearly Census data.14
The area-based poverty data were based on the smallest area levels available (SLA and CD level).11 These ecological factors can be seen as upstream determinants of health and disease status in a population, and there is a growing awareness of the effect of neighbourhood factors on individual health outcomes.15 Research indicates that oral health interventions should primarily focus on the socio-economic characteristics of neighbourhoods, which are more significant than individual socio-economic characteristics.16
Remoteness and geographic data
The level of accessibility and remoteness for each school was determined using the Accessibility/Remoteness Index of Australia (ARIA).17 ARIA uses distance to residential areas to measure service access and remoteness. ARIA remoteness is defined as the ability to access service centres, established by road distances. The five ARIA categories are ‘highly accessible’, ‘accessible’, ‘moderately accessible’, ‘remote’ and ‘very remote’.
Software systems
All data were downloaded and prepared for analysis using Microsoft Excel (Redmond, WA, US: Microsoft Corporation; Version 14). Integration of data and geographic analysis were completed using Quantum Geographic Information System (QGIS) (QGIS Development Team; Version 2.6.1 ‘Brighton’).
Index design
We constructed an Index of Dental Risk for each school. Baseline data for each school were integrated from the data sources using QGIS and Excel. We collated the address, longitude and latitude, CD/SLA, SEIFA decile, ARIA category, number of enrolled students, percentage of enrolled Indigenous students, and year-groups for each school.
In Western Australia, children start kindergarten at age 4 and complete year 12 at age 17. We used this typical age profile and the year-groups taught to create an even distribution of students across the specific years of schooling available at each school. This allowed us to calculate the age profile of students at all schools. For example, if a school had 700 students and the school offered years 1 to 7 (ages 6 to 12), the nominal allocation of students by age would be 100 students for each year-group. Using this method to calculate the typical age profile for school students, we found the number of children was approximately 30 000 in primary school (ages 5 to 12) and 25 000 in high school (ages 13 to 17).
The calculated number of students in each age group was collated and tested for validity against the 2011 Census data. As expected, it was found that the 2011 school-based ‘head count’ was higher than that in the Census. However, the increase (about 2–4% cumulative) over the 5-year period was a reasonable estimate, in light of population growth in Western Australia.
Using the proportion of Indigenous children for the CD/SLA that the school was in, the numbers of Indigenous and non-Indigenous children were calculated across each school. This estimate was also validated against the Census data and was found to be within 5%. Although this methodology may result in some error at the specific school level, it is reasonable to expect that the cumulative error would be minimal for more than 1000 schools and approximately 390 000 children.
For each school, an Index of Dental Risk was developed by integrating two driving factors relevant to childhood dental health: poverty and Indigenous status.8,9
The Index of Dental Risk formula derived was:
[(10 − SEIFA decile) × SEIFA weighting] + [(Indigenous Australian percentage per school ÷ 10) × Indigenous weighting]
The school-by-school Index of Dental Risk profile ranged from 0 (low risk) to 18 (very high risk). For simplicity, this was divided into four profiles of caries risk: low (0–4), medium (5–9), medium-high (10–14) and high (15–18).
A sensitivity analysis was conducted to test the robustness of the Index of Dental Risk against different SEIFA and Indigenous weightings. The effect of varying the ratio only improved the existing risk profile; it did not move schools greatly between the four risk profiles (low, medium, medium-high and high). Thus, the weightings for the SEIFA decile and Indigenous Australian percentage were kept at a 1:1 ratio.
Results
Index of Dental Risk
An Index of Dental Risk profile was constructed for each Western Australian school. Approximately 43% of schools had a low risk profile, 49% had a medium risk profile, 4.9% had a medium-high risk profile and 3.1% had a high risk profile. There were 3196 children in high risk–profile schools.
Nine schools with a high percentage of Indigenous students demonstrated the highest Index of Dental Risk profile of 18. These nine schools had a total of 1046 children and were in poor and mainly very remote regions of the state. Indigenous status was also compared against Index of Dental Risk school profiles.
Geography of Index of Dental Risk
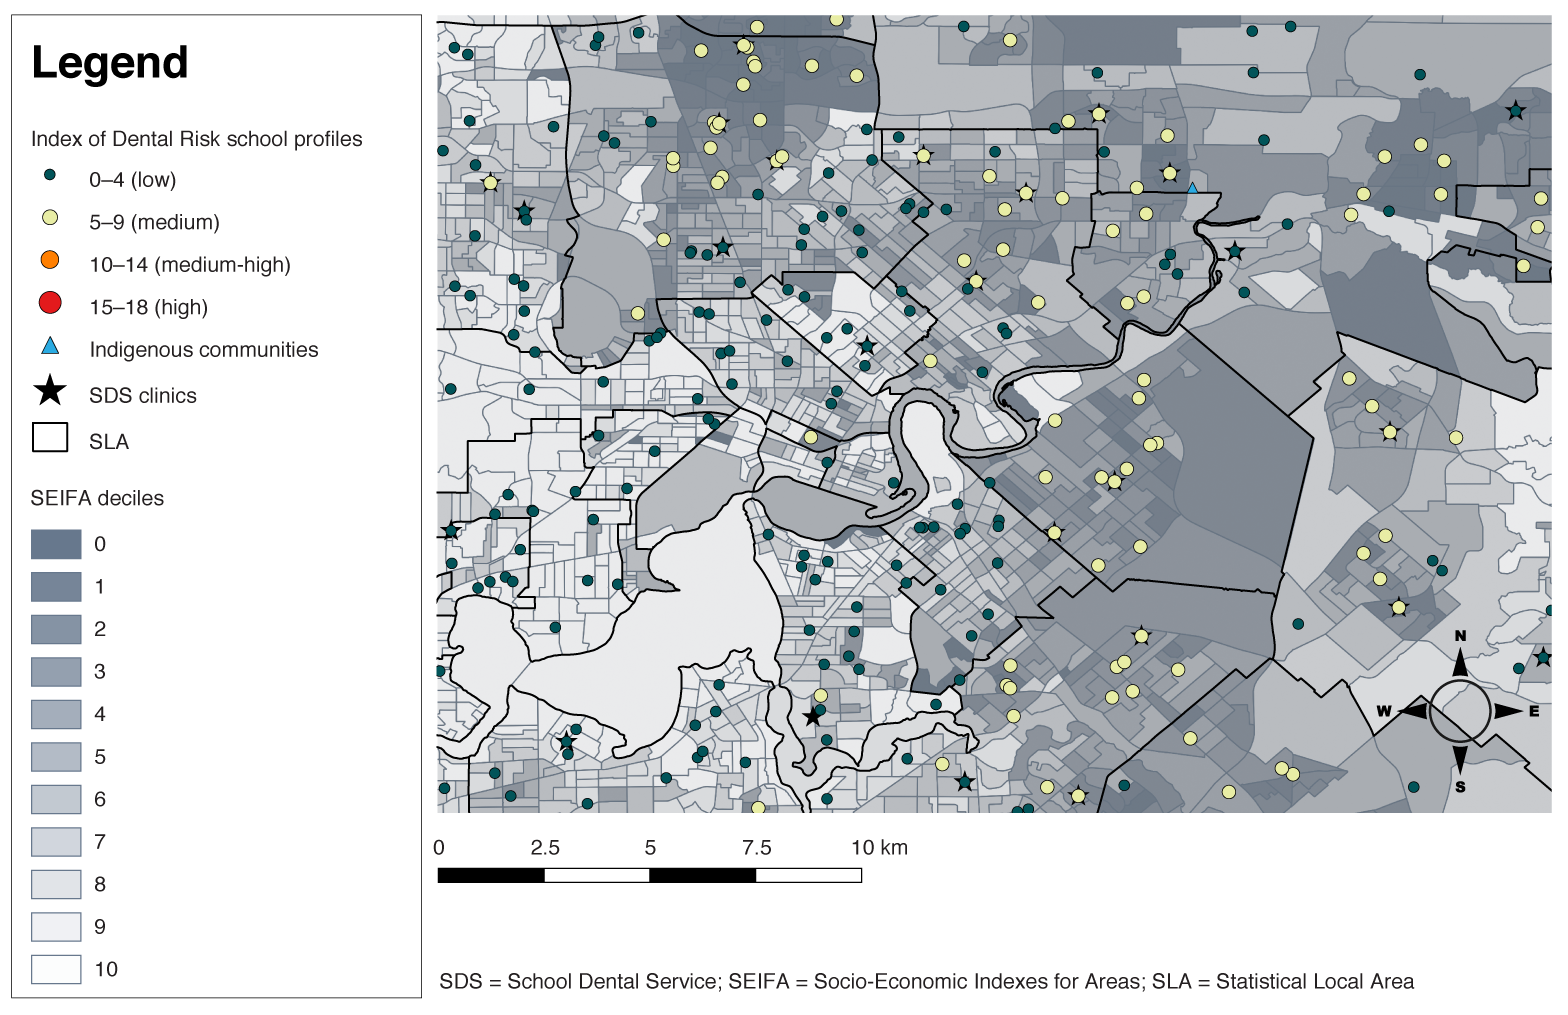
Geographical analysis showed that the schools with the highest risk profiles were predominantly in low socio-economic regions near Indigenous communities, and in the far north of the state in remote regions (Figure 1). Conversely, schools in the wealthy western suburbs of Western Australia’s capital city, Perth, mainly had low risk profiles (Figure 2). This finding reflects the high socio-economic status and low percentage of Indigenous people living in these regions.
Figure 1. Map depicting the Dental Risk Index profile for every identifiable school in Western Australia in 2011 (click to enlarge)
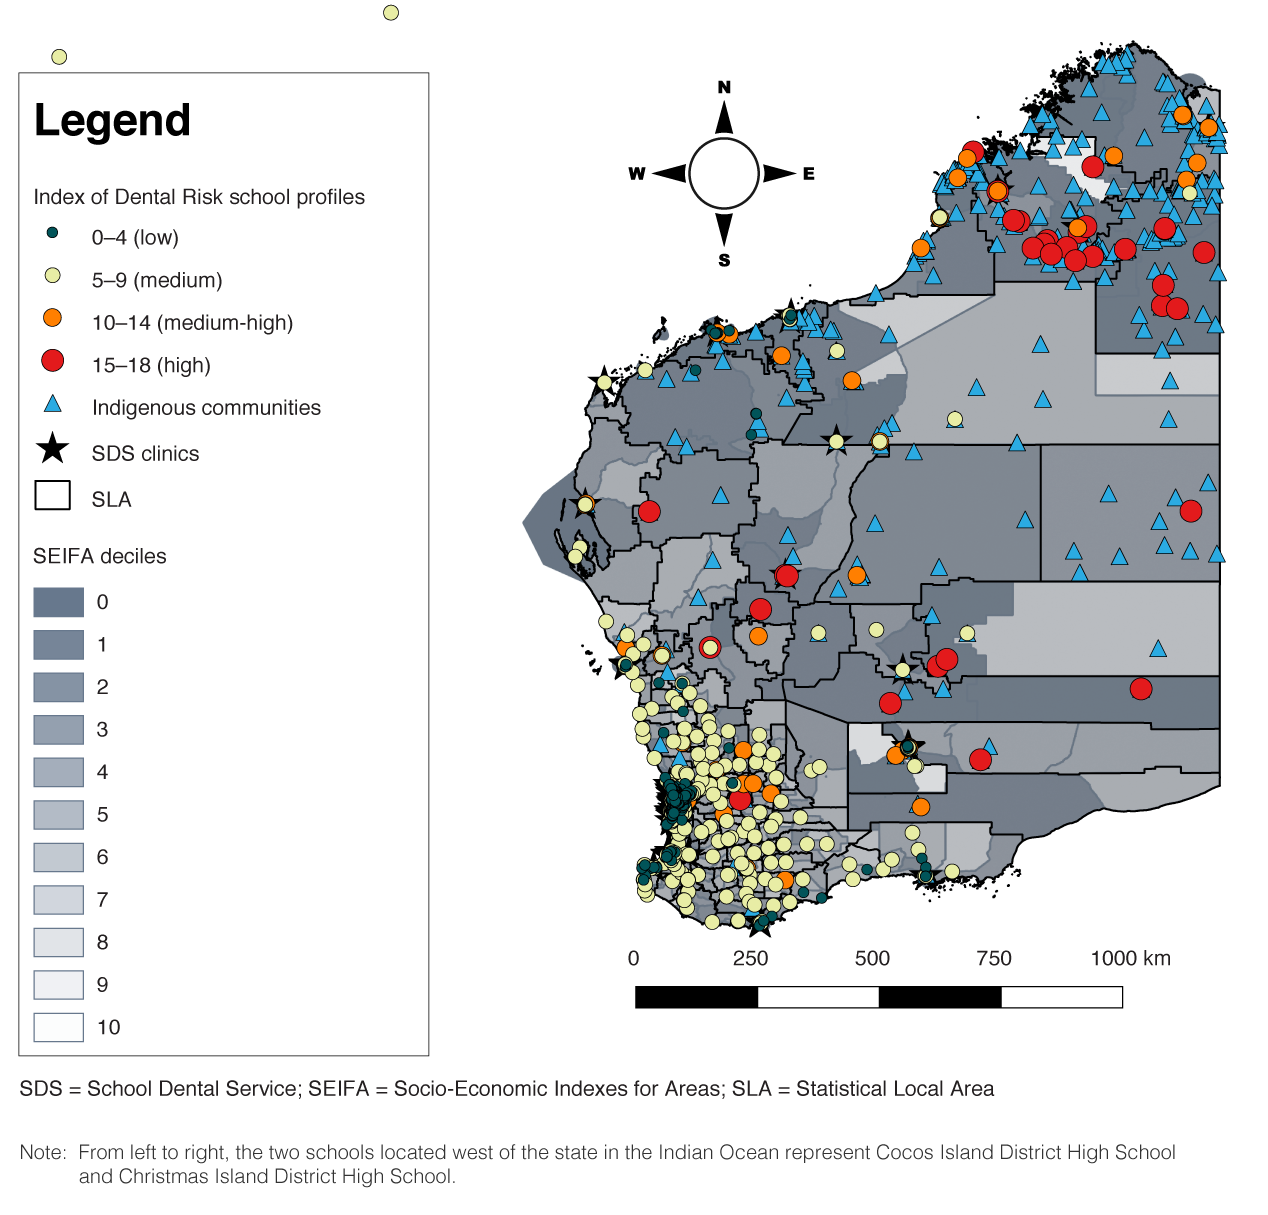
Figure 2. Map presenting the Index of Dental Risk profiles for schools magnified for the capital city of Perth. Throughout the metropolitan area, especially in the wealthier suburbs (light-shaded regions), low risk profiles were evident (click to enlarge)
Socio-economic status and remoteness classification
Each school was allocated a respective SEIFA decile and ARIA category (Tables 1 and 2). Most schools (55%) were in SEIFA deciles 1 to 5 (poorer areas), while 26% of schools were in the wealthiest three SEIFA deciles (deciles 8, 9, 10). Schools in highly accessible, accessible and moderately accessible regions totalled 944 (85%), while schools in remote and very remote regions totalled 168 (15%).
Table 1. Total number of Western Australian schools in 2011, by SEIFA decile and ARIA category
| SEIFA decile
|
ARIA category | Total | ||||
| Highly accessible | Accessible | Moderately accessible | Remote | Very remote | ||
| 1 (poorest) | 41 | 18 | 17 | 7 | 39 | 122 |
| 2 | 58 | 11 | 24 | 4 | 22 | 119 |
| 3 | 58 | 18 | 17 | 11 | 14 | 118 |
| 4 | 67 | 20 | 10 | 5 | 7 | 109 |
| 5 | 90 | 21 | 9 | 9 | 11 | 140 |
| 6 | 69 | 8 | 6 | 7 | 8 | 98 |
| 7 | 99 | 7 | 3 | 0 | 10 | 119 |
| 8 | 96 | 1 | 1 | 1 | 8 | 107 |
| 9 | 85 | 0 | 0 | 1 | 3 | 89 |
| 10 (wealthiest) | 89 | 1 | 0 | 0 | 1 | 91 |
| Total | 752 | 105 | 87 | 45 | 123 | 1112 |
ARIA = Accessibility/Remoteness Index of Australia; SEIFA = Socio-Economic Indexes for Areas
Table 2. Total number of Western Australian school children enrolled in 2011, by SEIFA decile and ARIA category
| SEIFA decile
|
ARIA category | Total | ||||
| Highly accessible | Accessible | Moderately accessible | Remote | Very remote | ||
| 1 (poorest) | 10 735 | 3 699 | 3 073 | 1 215 | 5 561 | 24 283 |
| 2 | 17 839 | 1 952 | 3 696 | 353 | 3 063 | 26 903 |
| 3 | 19 487 | 5 608 | 2 418 | 2 265 | 3 201 | 32 979 |
| 4 | 22 935 | 5 352 | 898 | 474 | 1 108 | 30 767 |
| 5 | 35 299 | 6 064 | 2 035 | 458 | 3 348 | 47 204 |
| 6 | 24 899 | 2 470 | 1 339 | 827 | 2 608 | 32 143 |
| 7 | 41 056 | 2 442 | 208 | 0 | 3 664 | 47 370 |
| 8 | 42 797 | 583 | 295 | 24 | 2 626 | 46 325 |
| 9 | 50 825 | 0 | 0 | 253 | 1 159 | 52 237 |
| 10 (wealthiest) | 47 979 | 536 | 0 | 0 | 393 | 48 908 |
| Total | 313 851 | 28 706 | 13 962 | 5 869 | 26 731 | 389 119 |
ARIA = Accessibility/Remoteness Index of Australia; SEIFA = Socio-Economic Indexes for Areas
Discussion
Adapting universal coverage to a rapidly changing demographic of disease patterns is a vital part of quality services. This study developed and tested a school-by-school Index of Dental Risk. The index is based on evidence of Indigenous Australians and people with low socio-economic status having the greatest oral disease burdens.4,8,9 These factors have been effectively integrated into a high-resolution mapping approach to target schools at high risk. This systematic approach to risk analysis is crucial for developing dynamic service models.
In a climate of increasing dental health–related hospitalisation7 and need for services, it is essential that resources are effectively targeted according to the greatest need. The school-level Index of Dental Risk gives public dental services the opportunity to integrate an evidence based approach into public health service planning.
The Index of Dental Risk also gives the school community knowledge of its own risk profile, empowering these communities to understand and determine their own demand for care. By supporting societal participation and health advocacy, such a tool accords with the community-enabling philosophy of contemporary public healthcare.18
Limitations
This is a preliminary Index of Dental Risk that has limitations. The index could be expanded by including more risk indicators for dental decay relevant to each community. These could include specific rates of dental hospitalisation for each school, so that public health and clinical attention could be targeted accordingly. A study by Armfield et al.19 emphasised that consuming sugar-sweetened beverages, such as soft drinks and sport drinks, should be considered a risk factor for dental decay. They also asserted that children who consumed high amounts of sugar-sweetened beverages had the highest levels of dental disease in both deciduous and permanent dentition. However, the Index of Dental Risk used population-level data because individual factors were most likely to be reflected in the primary risk indicators for dental decay (Indigenous status and poverty). As a public health measure, a key concern is to determine and control for the causes20 of dental decay linked to sugar consumption. Future research could consider incorporating additional risk factors into the index to target preventive strategies at high risk–profile schools.
Additionally, fixed School Dental Service clinics were identified but not examined in relation to their location and ability to effectively provide for the clinical needs of high-risk schools. Further research could investigate how closely these dental services are aligned to schools with the greatest clinical need.
Conclusions
This study developed an integrated school-by-school Index of Dental Risk based on known primary risk variables for dental decay: poverty and Indigenous status. This novel evidence based Index of Dental Risk can support the efficient allocation of resources to at-risk children, allowing for better public healthcare management. This index has the potential to reduce the cost burdens of oral health–related pathology in the community. Finally, this study could assist the development of a national, and potentially international, Index of Dental Risk based on known dental decay risk indicators specific to communities.
Peer review and provenance
Externally peer reviewed, not commissioned.
Copyright:

© 2018 Charkey et al. This work is licensed under a Creative Commons Attribution-NonCommercial-ShareAlike 4.0 International Licence, which allows others to redistribute, adapt and share this work non-commercially provided they attribute the work and any adapted version of it is distributed under the same Creative Commons licence terms.
References
- 1. Armfield JM, Spencer AJ. Quarter of a century of change: caries experience in Australian children, 1977–2002. Aust Dent J. 2008;53:151–9. CrossRef | PubMed
- 2. Ha D. Dental decay among Australian children. Canberra: Australian Institute of Health and Welfare; 2011 [cited 2015 May 15]. Available from: www.aihw.gov.au/reports/dental-oral-health/dental-decay-among-australian-children/contents/table-of-contents
- 3. Parker EJ, Jamieson LM, Broughton J, Albino J, Lawrence HP, Roberts‐Thomson K. The oral health of Indigenous children: a review of four nations. Aust Paediat J. 2010;46:483–6. CrossRef | PubMed
- 4. Kruger E, Tennant M. Ten years of hospitalisation for oral health-related conditions in Western Australia: an unjust dichotomy. Aust J Prim Health. 2015;22(2):153–8. CrossRef | PubMed
- 5. Australian Bureau of Statistics. Western Australia (STE) (5). Canberra: ABS; 2018 [cited 2017 Dec 6]; [about 4 screens]. Available from: stat.abs.gov.au/itt/r.jsp?RegionSummary®ion=5&dataset=ABS_REGIONAL_ASGS&geoconcept=REGION&datasetASGS=ABS_REGIONAL_ASGS&datasetLGA=ABS_NRP9_LGA®ionLGA=REGION®ionASGS=REGION
- 6. Dental Health Services. General dental care for school age children 2008. Perth: Government of Western Australia [Cited 2017 Dec 11]. Available from: www.dental.wa.gov.au/school/general.php (URL no longer active)
- 7. Alsharif A, Kruger E, Tennant M. Dental hospitalization trends in Western Australian children under the age of 15 years: a decade of population-based study. Int J Paediat Dent. 2014;25:35–42. CrossRef | PubMed
- 8. Christian B, Blinkhorn A. A review of dental caries in Australian Aboriginal children: the health inequalities perspective. Rural Remote Health. 2012;12(4):2032. PubMed
- 9. Dogar F, Kruger E, Dyson K, Tennant M. Oral health of pre-school children in rural and remote Western Australia. Rural Remote Health. 2011;11(4):1869. PubMed
- 10. Australian Bureau of Statistics. 2901.0 – Census dictionary, 2006 (Reissue). Managing Census Quality: Introduction. Canberra: ABS; 2011 [cited 2015 May 19]. Available from: www.abs.gov.au/AUSSTATS/[email protected]/Latestproducts/C55894126590F2E7CA257209000B66BB?opendocument
- 11. Australian Bureau of Statistics. 1216.0 - Australian Standard Geographical Classification (ASGC). Canberra: ABS;2011 [cited 2015 May 21]. Available from: www.abs.gov.au/ausstats/[email protected]/Previousproducts/1216.0Main%20Features12001?opendocument&tabname=Summary&prodno=1216.0&issue=2001&num=&view
- 12. Department of Education. List of schools. Perth: Western Australian Department of Education; [cited 2011 June 13]. Available from: www.det.wa.edu.au/schoolinformation/detcms/navigation/school-lists/
- 13. Australian Bureau of Statistics. 2901.0 - Census dictionary, 2006 (Reissue). Collection District (CD). [cited 2015 Mar 15]. Available from: www.abs.gov.au/AUSSTATS/[email protected]/bb8db737e2af84b8ca2571780015701e/413876f3bae9cc70ca25720a000c428b!OpenDocument
- 14. Pink B. Socio-Economic Indexes for Areas (SEIFA) 2011. Canberra: Australian Bureau of Statistics; 2013. [cited 2015 Apr 14]. Available from: www.ausstats.abs.gov.au/ausstats/subscriber.nsf/0/22CEDA8038AF7A0DCA257B3B00116E34/$File/2033.0.55.001%20seifa%202011%20technical%20paper.pdf
- 15. Armfield JM. Socioeconomic inequalities in child oral health: a comparison of discrete and composite area-based measures. J Pub Health Dent. 2007;67:119–25. CrossRef | PubMed
- 16. Turrell G, Sanders AE, Slade GD, Spencer AJ, Marcenes W. The independent contribution of neighborhood disadvantage and individual-level socioeconomic position to self-reported oral health: a multilevel analysis. Comm Dent Oral Epidemiol. 2007;35:195–206. CrossRef | PubMed
- 17. Australian Government Department of Health. Measuring remoteness: Accessibility/Remoteness index of Australia (ARIA). Canberra: Department of Health; 2011 [cited 2015 Apr 17]; [about 8 screens]. Available from: www.health.gov.au/internet/main/publishing.nsf/Content/health-historicpubs-hfsocc-ocpanew14a.htm
- 18. Hart JT. The inverse care law. Lancet. 1971;297:405–12. CrossRef | PubMed
- 19. Armfield J, Spencer A, Roberts-Thomson K, Plastow K. Water fluoridation and the association of sugar-sweetened beverage consumption and dental caries in Australian children. Amer J Pub Health. 2013;103(3):494–500. CrossRef | PubMed
- 20. Rose G. Sick individuals and sick populations. Int J Epidemiol. 2001;30(3):427–32. CrossRef | PubMed