Abstract
Objective: COVID-19 has left no healthcare system untouched. In New South Wales (NSW), the most populous state in Australia, COVID-19 case numbers have to date been relatively low. However, that does not mean the state’s healthcare system has been unaffected. Preparations to create sufficient capacity to accommodate a COVID-19 surge resulted in widespread deferment of scheduled medical procedures and appointments. Patterns of healthcare-seeking behaviour changed, with a reluctance to visit healthcare settings. The aim of this study was to quantify the changes in activity seen in the NSW health system in the first half of 2020.
Methods: Healthcare data were drawn from multiple sources, including primary care, ambulance, emergency departments and inpatient settings. Volumes of healthcare activity in 2020, overall, by urgency of cases and by reasons for care were compared with the figures for the same period in 2019. Changes in the modality of care provision were also examined.
Results: In March to June 2020, compared with the same period in 2019, primary care face-to-face consultations decreased by 22.1%, breast screening activity by 51.5%, ambulance incidents by 7.2%, emergency department visits by 13.9%, public hospital inpatient episodes by 14.3%, and public hospital planned surgical activity by 32.6%.
Conclusion: There were substantial declines in a wide range of healthcare activities across the NSW health system between March and June 2020 due to the impact of the COVID-19 pandemic. Although activity levels were recovering by September 2020, they had not yet returned to ‘normal’. The implications of these changes – and the indirect impact of COVID-19 – require further study.
Full text
Introduction
Coronavirus disease 2019 (COVID-19) has affected every healthcare system around the world. In New South Wales (NSW), with only 3726 cases reported from 1.7 million tests (up to 11 August 2020), the public health response has to date been successful in attenuating the pandemic (Figure 1). However, the impact of COVID-19 reaches far beyond actual cases.
Figure 1. COVID-19 cases and tests, NSW, 1 January–11 August 2020 (click to enlarge)

Source: Notifiable Conditions Information Management System, Public Health Response Branch, NSW Ministry of Health; data extracted Friday 28 August 2020.
Preparations by healthcare systems and organisations for a possible major outbreak resulted in significant changes to routine services. These included postponement of scheduled care, such as elective surgery, and reconfiguration, such as a shift to virtual care. Patients’ healthcare-seeking behaviour also changed significantly, due to concerns about infection risks1-3 and a reluctance to burden the system as it dealt with COVID-19 cases.4 Available information does not allow us to easily establish the underlying reasons for changes in activity. However, we may assume that, where services such as elective surgery and breast screening were cancelled, the data reflect system changes; where there have been fewer presentations – such as in primary care and the emergency department (ED) – the data reflect patient choices; and where there have been changes in the nature of presentations – such as a reduction in trauma cases – the data reflect changes in patient behaviour.
Foregone care, delays and postponements have been widespread. This article draws on a range of datasets to describe changes in activity across the healthcare system in NSW. It outlines changes in activity in different domains of the system (ambulance, cancer screening, ED, hospital and operating theatres), in the acuity of cases that presented for care, in the reasons for seeking care or presenting complaints, in the volumes of key procedures, in patterns of delivery of care and in numbers of deaths. The data for 2020 are compared with data for the corresponding period in 2019.
Background
NSW has a population of about 8 million people and covers an area of about 801 000 km2. NSW Health is a publicly funded healthcare system and employs more than 110 000 people, working across more than 220 public hospitals and health services around the state. In a ‘normal’ year, there are more than 1.9 million hospitalisations and almost 3 million ED visits.5
The first Australian case of COVID-19 was recorded in late January 2020. In March, national borders were closed to non-residents and non–Australian citizens, and mandatory 14-day hotel quarantine was put in place for Australians returning from overseas. All non-urgent elective surgery was temporarily suspended in public and private hospitals. State and territory governments introduced increasingly stringent lockdowns and restrictions on people’s ability to work, travel, gather and interact. In NSW, the tightest restrictions on movement and interactions were in place during April and the first half of May. Schools remained open, but parents were encouraged to keep children at home.
Methods
The study looked at indirect impacts of COVID-19 by assessing changes in the volume of healthcare activity, acuity of presentations, reasons for care and modality of delivery. Data were drawn from multiple sources (Table 1).
Not all measures explored are presented in this paper. Indicators were calculated according to current monitoring plans in NSW. Indicator definitions can be provided by the authors on request. Ethics approval was not required as the study is based on de-identified data from NSW and Federal Government databases as outlined in Table 1.
Table 1. Sectors and data sources
| Sector | Data source | Data type | Information |
| Primary care | Online Medicare item reports, Services Australia6 | Face-to-face consultation item numbers 23, 3, 36, 44; telehealth item numbers 91790, 91800, 91801, 91802; telephone item numbers 91795, 91809, 91810, 91811 | Volumes and modes of delivery of care (e.g. face-to-face versus virtual) |
| Ambulance | NSW Ambulance Information System7 | Ambulance incidents (calls that generate an ambulance response) | Volumes, priority, patient complaint (i.e. nature of call – assigned according to the Medical Priority Dispatch System protocol) |
| Emergency department (ED) | Public Health Rapid, Emergency, Disease and Syndromic Surveillance system, which uses a stable cohort of 67 EDs that accounted for about 87% of all ED activity in NSW in 2018–20198 | ED presentations | Volumes, acuity, surveillance syndrome (diagnosis based) |
| Hospital inpatient | NSW Health Information Exchange, accessed via the Quality Improvement Data System, Clinical Excellence Commission9 | Public hospital inpatient episodes | Volumes, principal diagnosis, procedure |
| Planned surgery | Waiting List Collection On-line System, managed by the System Information and Analytics Branch at the NSW Ministry of Health10 | Public hospital planned surgical activity | Volumes, urgency |
| Breast cancer screening | BreastScreen NSW, Cancer Institute NSW11 | Breast screening | Volumes |
| Mental health | NSW Health Information Exchange12 | ED mental health presentations, community mental health service referrals | Volumes |
| Non-admitted care | Non-Admitted Patient Data Collection13 | Non-admitted patient videoconference service events | Modes of delivery of care (e.g. videoconference) |
| Deaths | Australian Bureau of Statistics14 | Doctor-certified deaths registered in NSW | Volumesa |
a Cause of death data not available.
Note: All data available from authors pending data custodian approval.
Results
Volume of activity
The 4-month period from March to June 2020 (inclusive) saw a substantial drop in healthcare activity in NSW, compared with the same period in 2019. Altogether, primary care face-to-face consultations decreased by 22.1%, breast cancer screening activity by 51.5%, ambulance incidents by 7.2%, ED visits by 13.9%, public hospital inpatient episodes by 14.3%, public hospital planned surgical activity by 32.6%, and mental health service activity by 3.3% for inpatient episodes and by 8.3% for the number of new community clients. The largest decreases occurred in April and May (Table 2 and Figure 2). In June, although many activities remained subdued, there were increases in new mental health community clients, ED presentations and hospital admissions (Figure 3).
Figure 2. Percentage change in healthcare activity, NSW, March–June 2020 (compared with 2019) (click to enlarge)
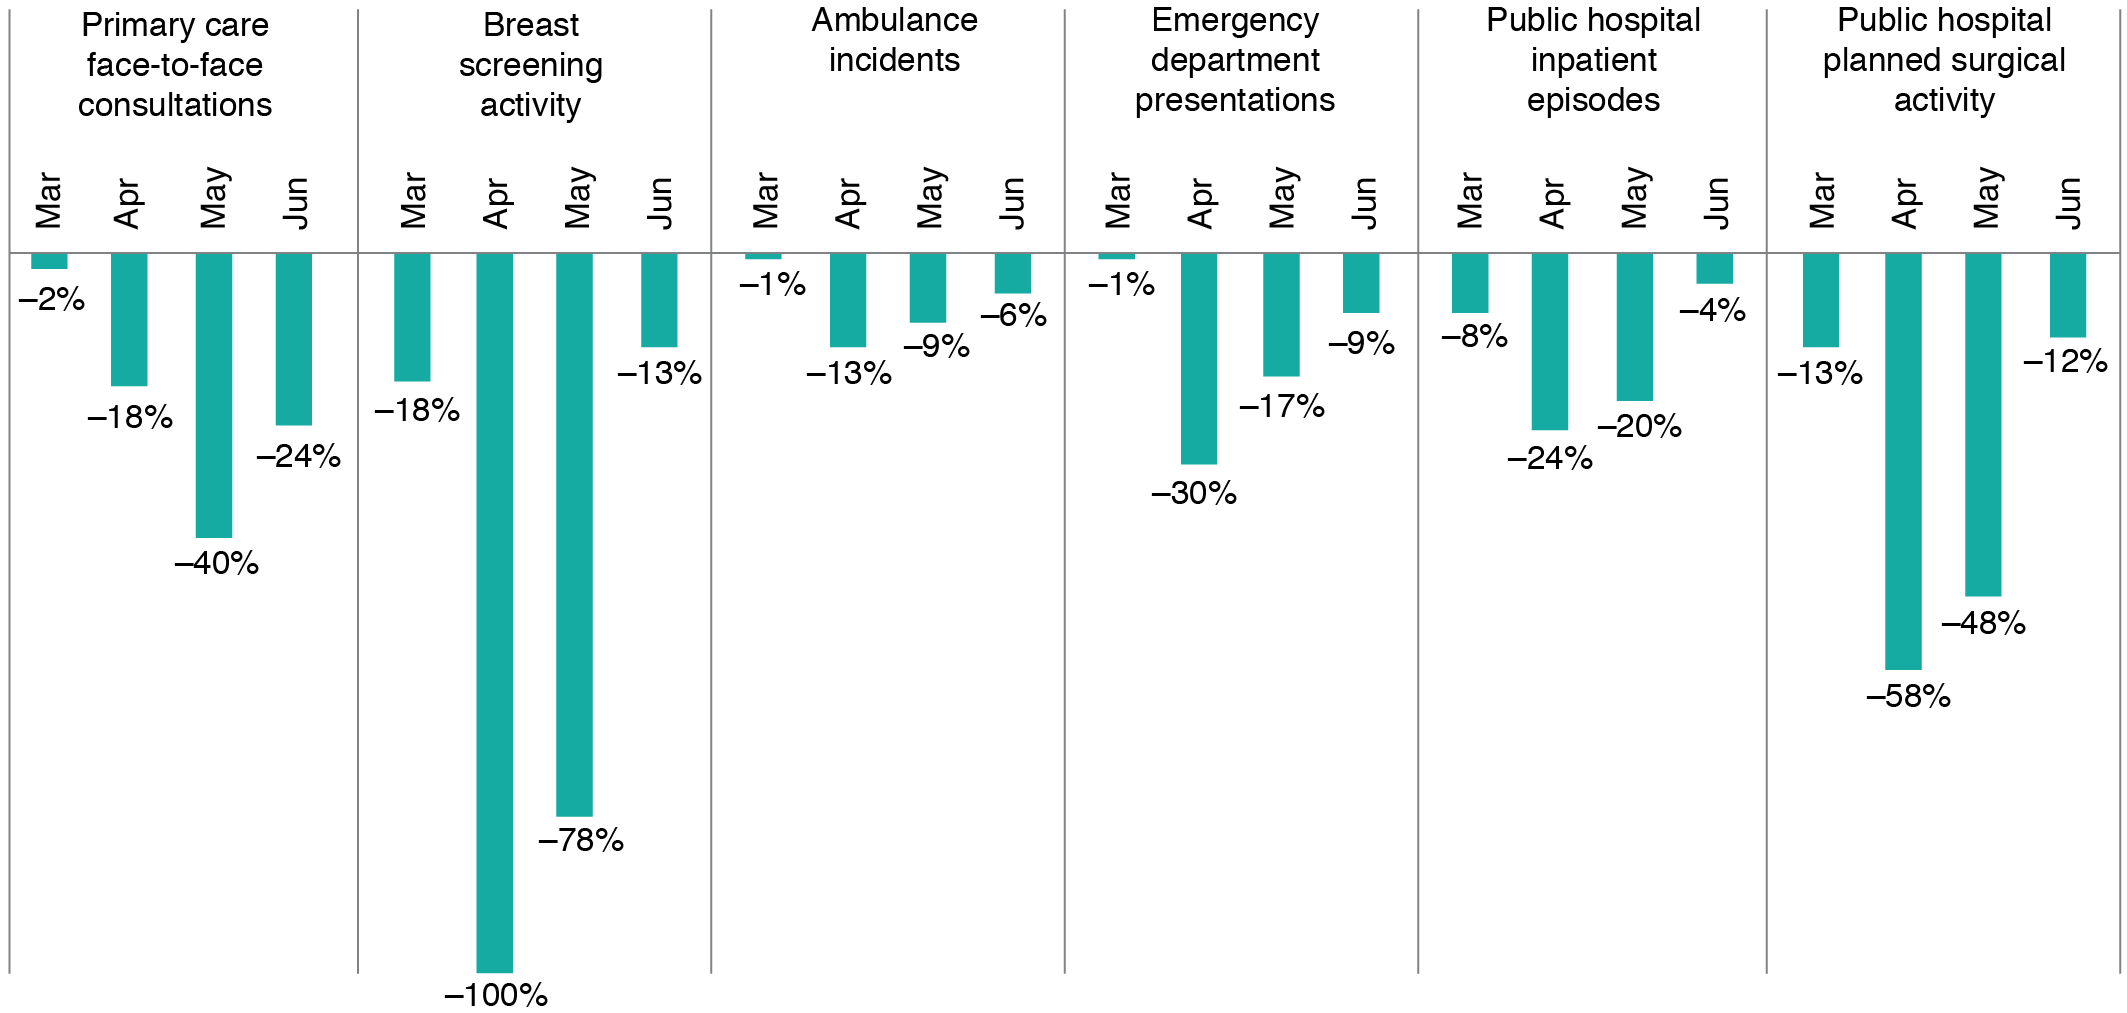
Figure 3. Percentage change in mental health service activity, NSW, March–June 2020 (compared with 2019) (click to enlarge)

Table 2. Aggregate impact of COVID-19 on healthcare activity, NSW, March–June 2020 (compared with 2019)
| Activity | March 2020 | April 2020 | May 2020 | June 2020 | March–June 2020 |
| Primary care face-to-face consultations | 3 401 101 (–2.4%) |
2 675 467 (–18.5%) |
2 549 676 (–39.8%) |
2 568 122 (–23.8%) |
11 194 366 (–22.1%) |
| Breast screening (service suspended 24 March–18 May) | 25 991 (–17.9%) |
0 (–100.0%) |
7 169 (–78.1%) |
25 318 (–13.1%) |
58 478 (–51.5%) |
| Ambulance incidents | 81 835 (–0.8%) |
68 405 (–13.1%) |
73 172 (–9.4%) |
76 501 (–5.9%) |
299 913 (–7.2%) |
| Emergency department (ED) presentations | 260 802 (–0.8%) |
181 436 (–29.6%) |
210 136 (–17.1%) |
232 028 (–8.6%) |
884 402 (–13.9%) |
| ED mental health presentations | 8 420 (–8.1%) |
7 430 (–12.5%) |
7 465 (–0.5%) |
7 272 (5.8%) |
30 587 (–4.0%) |
| Public hospital inpatient episodes | 153 126 (–8.2%) |
120 004 (–24.3%) |
137 275 (–20.2%) |
149 991 (–4.2%) |
560 396 (–14.3%) |
| Public hospital acute mental health inpatient episodes | 3 260 (–11.8%) |
2 881 (–2.9%) |
3 155 (–2.1%) |
2 966 (4.3%) |
12 262 (–3.3%) |
| Public hospital planned surgical activity | 17 763 (–12.8%) |
7 626 (–57.5%) |
11 788 (–47.9%) |
16 523 (–11.6%) |
53 700 (–32.6%) |
| New community mental health service clients | 6 281 (–16.7%) |
5 080 (–17.3%) |
6 071 (–11.6%) |
5 301 (14.0%) |
22 733 (–8.3%) |
| Doctor-certified deaths | 1 January to 28 April 2020: 14 986 (0.4%) | ||||
Acuity
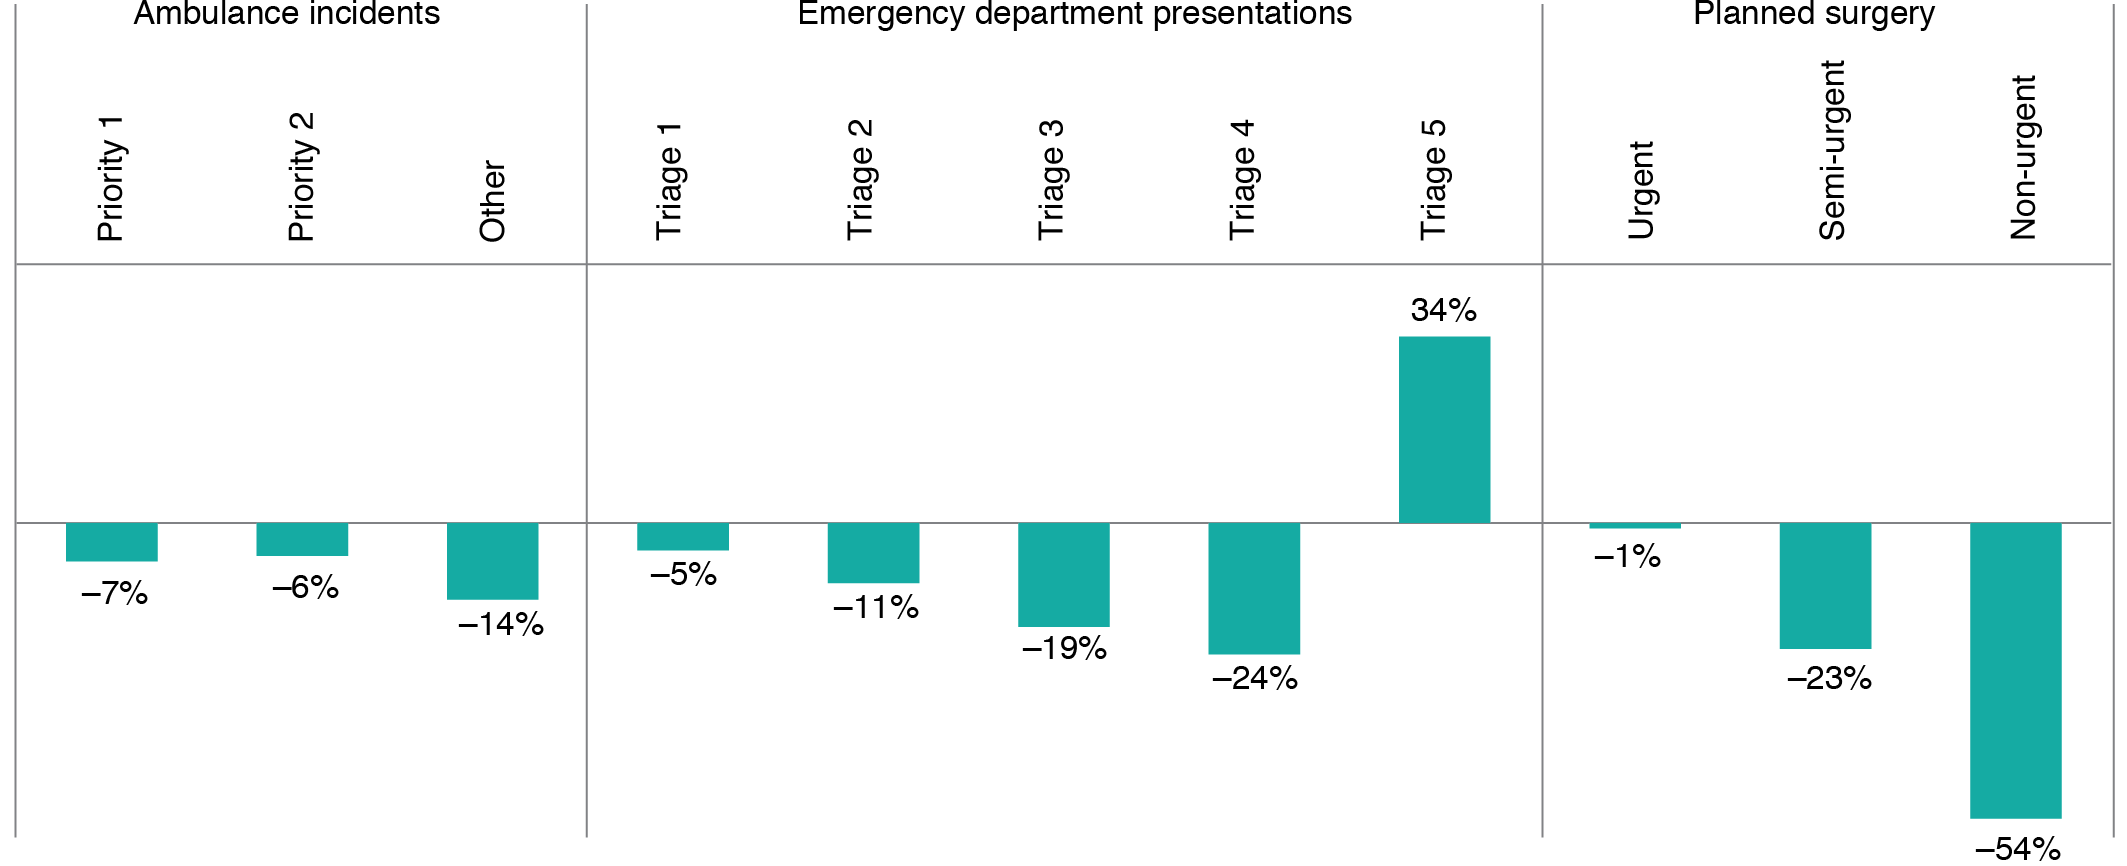
Decreases in the volume of activity were not uniform across measures of acuity (urgency). For ambulance incidents, there was a decrease in all priority groups between March and June 2020 compared with 2019, most notably in ‘other’ incidents (mostly transfers from nursing homes or medical centres). This decrease in ‘other’ incidents represented a change in the way that nursing home calls were handled during COVID-19.
For EDs, the number of lowest-acuity (triage category 5) visits increased by 34%, and numbers of the other four more urgent triage categories decreased. The increase in lowest-acuity visits was most notable in March and was primarily driven by COVID-19 testing in EDs before the establishment of community testing clinics (data not shown).
For planned surgical activity, the greatest decrease was in non-urgent surgery (recommended waiting time within 365 days) at 54%. The largest decreases occurred in April and May (data not shown). For urgent surgery (within 30 days) and semi-urgent surgery (within 90 days), the reductions in activity were 1% and 23%, respectively (Figure 4).
The changes seen in acuity do not reflect uniform changes in the reasons for patients seeking care. For example, the increase in lower-acuity ED presentations reflects an increase in people attending for COVID-19 assessment and testing, particularly at some facilities; all other syndromes saw a decrease in low-acuity presentations.
Figure 4. Percentage change in healthcare activity by acuity, NSW, March–June 2020 (compared with 2019) (click to enlarge)
Reasons for care
In the case of ambulance incidents (Appendix Figure 1a, available from: doi.org/10.6084/m9.figshare.13272605.v1), activity levels were driven by a number of underlying factors. Call-outs for breathing problems had a large relative (and absolute) increase in March and then declined. Call-outs that related to exposure to certain activities (e.g. traumatic injuries, traffic accidents, assaults) fell. Traumatic injuries had the largest relative decrease in May compared with calls for other reasons, and returned to usual levels in July. Call-outs for mental health incidents (including abnormal behaviour and suicide attempt) were higher than in 2019 from January 2020 onwards, reflecting a multiyear trend of increasing incidents (data not shown).
For EDs, there was a decrease in March and April in unplanned presentations for all diagnosis-based surveillance syndromes except respiratory illness, fever or unspecified infection (RFUI). RFUI presentations increased in the first 3 weeks of March and returned to usual levels in mid-April (Appendix Figure 1b, available from doi.org/10.6084/m9.figshare.13272605.v1). The increase in respiratory presentations was driven by increases in low-triage (non-urgent) cases. Between 5 March and 22 April 2020, respiratory presentations in triage categories 4–5 (the least urgent categories) increased from an average of 15 036 in 2019 to 46 212 in 2020; for triage categories 1–3, the corresponding figures were 31 930 in 2019 and 26 268 in 2020. A marked decrease in ED presentations for injury was seen across all triage categories (including the most urgent category: triage category 1).
For hospitalisations, there was a decrease across most diagnosis categories between March and June 2020, particularly for diseases of the respiratory system, eye, adnexa and musculoskeletal system (Appendix Figure 1c, available from doi.org/10.6084/m9.figshare.13272605.v1). For procedures, there was a decrease in some potentially low-value care, such as tonsillectomy and grommet insertion (Appendix Figure 1d, available from doi.org/10.6084/m9.figshare.13272605.v1).
Modality
As well as changes in activity, acuity and reasons for seeking healthcare, the modality of care provision also changed in the first half of 2020. For example, in primary care, there was a marked decrease in face-to-face consultations between March and June 2020, and an increase in virtual consultations, including telephone and video consultations (Figure 5). (In Australia, the Federal Government funds primary care activity via a system called Medicare. In March 2020, a Medicare Benefits Schedule rebate for virtual consultations was introduced, meaning general practitioners could make a claim for these types of services).
In non-admitted hospital care, there was a rapid rise in videoconferencing, with almost 80 000 videoconferences in March–May 2020, compared with about 7000 in March–May 2019 (Figure 6).
NSW specialist community mental health services reported a rapid change to telephone and video contact. Before COVID-19, these comprised around 20% of total community care hours. This increased to 48% in mid-April and comprised 30% in June 2020.
Figure 5. General face-to-face primary care consultations, 2017–2020, and general consultations by telephone and telehealtha, 2020, NSW (click to enlarge)
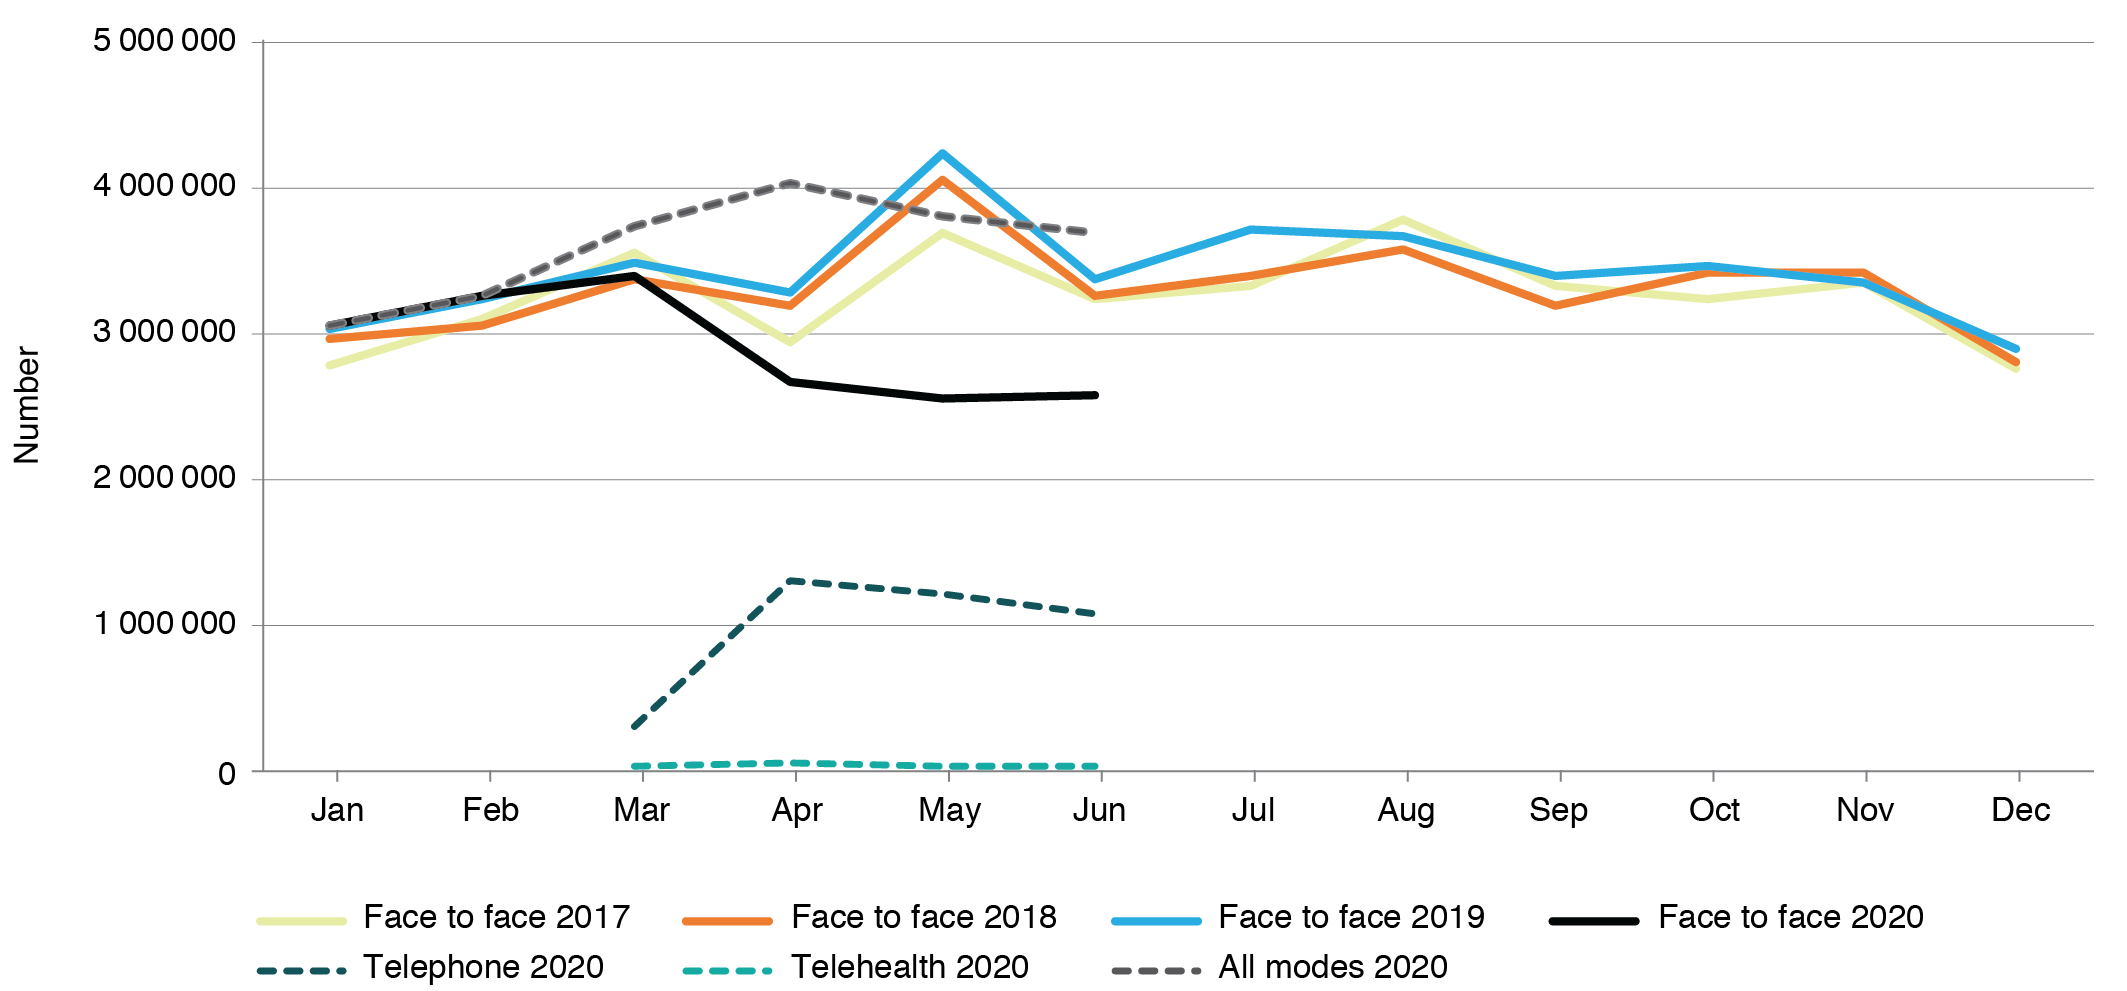
a Telehealth refers to video consultations
Figure 6. Non-admitted hospital videoconference service events, NSW, 2020 (click to enlarge)

Discussion
The period from March to June 2020 saw marked decreases across almost all areas of healthcare activity in NSW, in both quantitative (volume, reasons) and qualitative (acuity, modality) terms. There were two notable exceptions. First, low-acuity presentations to EDs showed an increase in demand, particularly in mid- to late March. Almost all of this demand was for respiratory conditions – primarily from patients concerned that they may have COVID-19. These presentations decreased when community-based COVID-19 testing facilities were set up in NSW. There may have been other reasons for the temporary increase in low-acuity presentations that the available data are unable to reveal – for example, reduced access to primary care (or limited face-to-face appointments), leading to people seeking care at the ED for minor illnesses. Secondly, mental health presentations to community teams, EDs and public hospitals declined in April and May but were above the 2019 baseline in June 2020. This may reflect the impacts of the pandemic on mental health and wellbeing in the NSW community, including impacts on people already living with mental health conditions.15
The changes in healthcare activity are important and may highlight public sentiment – reflecting attitudes such as trust, confidence and fear in relation to the healthcare system.16 Early in the outbreak, the overall number of people presenting to primary care and to hospital EDs fell sharply. There were even decreases in presentations for conditions that, before the COVID-19 pandemic, would have been characterised as nondiscretionary or ‘inelastic demand‘ – for example, acute coronary syndrome or stroke.
Potentially there could be serious consequences if patients do not access timely preventive care, or delay seeking treatment when symptoms first develop. The indirect impacts of COVID-19 are defined in this study as any outcome or effect on healthcare systems, services, consumers or communities that are not a direct consequence of COVID-19 infections.
There is international concern about the indirect impacts of COVID-19. A modelling study in England found that modest delays in surgery for some cancers had a significant impact on outcomes and decreased survival.17 These impacts were particularly marked for aggressive cancers: delays of 1–6 months were associated with >30% reduction in survival at 6 months and >17% reduction in survival at 3 months for patients with stage 2 or 3 cancers of the bladder, lung, oesophagus, ovary, liver, pancreas and stomach.
Patients with cardiovascular conditions have also been affected. International data show an increase in out-of-hospital cardiac arrests and deaths18, missed opportunities to offer secondary preventive treatment, and increases in medium- and long-term complications in cardiac care during the COVID-19 pandemic.3 For stroke patients, international studies demonstrate longer times to reperfusion and decreased use of telestroke (the use of technology by clinicians to treat stroke patients in another location) during the COVID-19 pandemic – both of which are strongly associated with better patient outcomes.19-21
However, not all indirect impacts of the COVID-19 pandemic are detrimental. Compared with previous winters, 2020 has so far been distinguished by low rates of other respiratory infections such as influenza in NSW22 – a dividend of non-pharmacological controls put in place to manage COVID-19. Similarly, sharp decreases in trauma-related injury in March and April shown in this study reflect government-imposed restrictions on social and work activity, and a consequential reduction in underlying behaviours that result in accidents (both leisure and work related).
In the case of low-value procedures, the COVID-19 pandemic presents an opportunity to revisit and potentially prevent the resumption of such activities. For example, tonsillectomy has been found to have been performed when not indicated23, and the number of procedures performed in NSW public hospitals in April dropped precipitously (but then started to increase again).
Our study provides a first step in assessing the indirect impact of COVID-19 in NSW. It does, however, have important limitations – it draws on administrative data, which are unable to capture in detail the treatments provided to patients and many changes in severity of disease. The analysis focuses on a relatively short time period, and the full picture is still emerging. Although it is possible to track changes in activity, and to estimate backlog, pent-up demand and foregone care, it is more challenging to assess the impact of perturbed patterns of delivery on patient experience, morbidity and mortality. It will be important for subsequent studies to assess healthcare outcomes related to foregone care, such as an increase in rates of chronic disease.
The COVID-19 pandemic has led to marked changes in the way people use healthcare services in NSW – because of both alterations in the services that are offered and available, and changes in healthcare-seeking behaviours. We are yet to see if these changes will be temporary or permanent.
Many healthcare systems are seeking to assess and mitigate the indirect impacts and unintended consequences (‘collateral damage’) from COVID-19.17,24-26 There is a pressing need for a comprehensive suite of measures to assess these impacts. Future work in NSW will focus on developing proposals for measurement, data definitions and time horizons for data collection with healthcare professionals and the community, as well as building consensus around clinical, organisational and system interventions to address and remediate the indirect impacts of COVID-19.
Conclusion
Healthcare systems have had to adapt rapidly to the challenges presented by COVID-19. In NSW, healthcare-seeking behaviour changed, and service provision was modified to protect healthcare capacity and prevent infection. Different healthcare systems have seen varying patterns of changes in healthcare activity – depending on prevalence, the stage of the pandemic and local policy. The same types of change resonate across jurisdictions both in Australia and globally. These changes mean that all healthcare systems should now prepare for indirect impacts of the COVID-19 pandemic.
Peer review and provenance
Externally peer reviewed, invited.
Acknowledgements
We would like to acknowledge Rapid Surveillance, Centre for Epidemiology and Evidence, NSW Ministry of Health for provision of PHREDSS (Public Health, Rapid, Emergency, Disease and Syndromic Surveillance) data and advice on the manuscript; the System Information Analytics Branch, NSW Ministry of Health, for provision of surgery, mental health and videoconference data, and advice on the manuscript; NSW Ambulance for provision of ambulance incident data; and the Cancer Institute NSW for provision of breast screening data.
Copyright:

© 2020 Sutherland et al. This work is licensed under a Creative Commons Attribution-NonCommercial-ShareAlike 4.0 International Licence, which allows others to redistribute, adapt and share this work non-commercially provided they attribute the work and any adapted version of it is distributed under the same Creative Commons licence terms.
References
- 1. Ciacchini B, Tonioli F, Marciano C, Grazia Faticato M, Borali E, Pini Prato A, Felici E. Reluctance to seek pediatric care during the COVID-19 pandemic and the risks of delayed diagnosis. Ital J Pediatr. 2020;46:87. CrossRef | PubMed
- 2. Toniolo M, Negri F, Antonutti M, Masè M, Facchin D. Unpredictable fall of severe emergent cardiovascular diseases hospital admissions during the COVID‐19 pandemic: experience of a single large center in northern Italy. J Am Heart Assoc. 2020;9(31):e017122. CrossRef | PubMed
- 3. Mafham MM, Spata E, Goldacre R, Gair D, Curnow P, Bray M, et al. COVID-19 pandemic and admission rates for and management of acute coronary syndromes in England. Lancet. 2020;396:381–89. CrossRef | PubMed
- 4. Robinson A. We GPs don’t want people with non-Covid health problems to suffer in silence. London: The Guardian; 24 Apr 2020 [cited 2020 Aug 25]. Available from: www.theguardian.com/commentisfree/2020/apr/24/gp-covid-patients-doctors-coronavirus
- 5. NSW Ministry of Health. NSW Health annual report 2018–19. Sydney: NSW Government: 2019 [cited 2020 Aug 25]. Available from: www.health.nsw.gov.au/annualreport/Publications/annual-report-2019.pdf
- 6. Services Australia. Medicare Item Reports. Canberra: Australian Government; 2020 [cited 2020 Aug 14]. Available from: medicarestatistics.humanservices.gov.au/statistics/mbs_item.jsp
- 7. NSW Ambulance. NSW Ambulance Information System. Sydney: NSW Government; [cited 2020 Aug 11]. Available from authors.
- 8. Centre for Epidemiology and Evidence, NSW Ministry of Health. NSW Health Public Health Rapid, Emergency, Disease and Syndromic Surveillance (PHREDSS) system. Sydney: NSW Government; [cited 2020 Aug 26]. Available from authors.
- 9. NSW Ministry of Health. Health Information Exchange. Accessed via the Quality Improvement Data System, Clinical Excellence Commission; [cited 2020 Aug 14]. Available from authors.
- 10. NSW Ministry of Health. Waiting List Collection On-line System. Sydney: NSW Government; [cited 2020 Jul 20]. Available from authors.
- 11. Cancer Institute NSW. Breast screen activity and participation data. Sydney: NSW Government; [cited 2020 Aug 20]. Available from authors.
- 12. NSW Ministry of Health. Health Information Exchange; [cited 2020 Aug 26]. Available from authors.
- 13. NSW Ministry of Health. Non-Admitted Patient Data Collection. Sydney: NSW Government; [cited 2020 Jun 18]. Available from authors.
- 14. Australian Bureau of Statistics. Provisional mortality statistics, Australia, Jan–April 2020. Canberra: ABS; [cited 2020 Jul 22]. Available from: www.abs.gov.au/statistics/health/causes-death/provisional-mortality-statistics/jan-apr-2020
- 15. Newby JM, O’Moore K, Tang S, Christensen H, Faasse K. Acute mental health responses during the COVID-19 pandemic in Australia. PLoS ONE. 2020;15(7):e0236562. CrossRef | PubMed
- 16. Lazzerini M, Barbi E, Apicella A, Marchetti F, Cardinale F, Trobia G. Delayed access or provision of care in Italy resulting from fear of COVID-19. Lancet Child Adolesc Health. 2020;4642:2019–20. CrossRef | PubMed
- 17. Sud A, Torr B, Jones ME, Broggio J, Scott S, Loveday C, et al. Effect of delays in the 2-week-wait cancer referral pathway during the COVID-19 pandemic on cancer survival in the UK: a modelling study. Lancet Oncol. 2020;21(8):1035–44. CrossRef | PubMed
- 18. Marijon E, Karam N, Jost D, Perrot D, Frattini B, Derkenne C, et al. Out-of-hospital cardiac arrest during the COVID-19 pandemic in Paris, France: a population-based, observational study. Lancet Public Health. 2020;5(8):e437–43. CrossRef | PubMed
- 19. Montaner J, Barragán-Prieto A, Pérez-Sánchez S, Escudero-Martínez I, Moniche F, Sánchez-Miura JA, et al. Break in the stroke chain of survival due to COVID-19. Stroke. 2020;51(8):2307–14. CrossRef | PubMed
- 20. Schirmer CM, Ringer AJ, Arthur AS, Binning MJ, Christopher Fox W, James RF, et al. Delayed presentation of acute ischemic strokes during the COVID-19 crisis. J Neuro Interven Surg. 2020;12:639–42. CrossRef | PubMed
- 21. Frisullo G, Brunetti V, Di Iorio R, Broccolini A, Caliandro P, Monforte M, et al. Effect of lockdown on the management of ischemic stroke: an Italian experience from a COVID hospital. Neurol Sci. 2020;41(9):2309–13. CrossRef | PubMed
- 22. NSW Health. COVID-19 Weekly Surveillance in NSW. Epidemiological Week 36, Ending 5 September 2020. Sydney: NSW Government; [cited 2020 Nov 23]. Available from: www.health.nsw.gov.au/Infectious/covid-19/Documents/covid-19-surveillance-report-20200905.pdf
- 23. Sumilo D, Nichols L, Ryan R, Marshall T. Incidence of indications for tonsillectomy and frequency of evidence-based surgery: a 12-year retrospective cohort study of primary care electronic records. Br J Gen Pract. 2019;69(678):e33–41. CrossRef | PubMed
- 24. Masroor S. Collateral damage of COVID-19 pandemic: delayed medical care. J Card Surg. 2020;35(6):1345–7. CrossRef | PubMed
- 25. Feral‐Pierssens A‐L, Claret P‐G, Chouihed T. Collateral damage of the COVID‐19 outbreak: expression of concern. Eur J Emerg Med. 2020;27(4):233–4. CrossRef | PubMed
- 26. Rosenbaum L. The untold toll – the pandemic's effects on patients without Covid-19. N Engl J Med. 2020;382(24):2368–71. CrossRef | PubMed