Abstract
Background: Advances in geographic information systems (GIS) and increased availability of routinely collected data have the potential to contribute to public health and health services research. The aim of this feasibility study was to explore the use of GIS to measure access to general practices and its relationship to selected antenatal behaviours.
Methods: We obtained the Perinatal Data Collection, 2004−2008, for South Western Sydney Local Health District from the New South Wales Ministry of Health. Using a GIS, we generated circular and polygon-based 1 km and 2 km road network buffers from a maternal residential address and then calculated the number of general practices within those buffers (density measures). Distances to general practices from maternal residences were also calculated in the GIS as another measure of geographic access to general practices (proximity measures). We used generalised estimating equations logistic regression to examine associations between access to general practices, and smoking during pregnancy and late first antenatal visit.
Results: The numbers of general practices within circular buffers were significantly greater than within polygon-based road network buffers. The average distance to the five closest general practices from a mother’s residence was 2.3 km ± 3.0 km (median 1.4 km, range 0.05 km to 40.0 km). For two of the five measures of access, a higher number of general practices was associated with increased risk for late first antenatal visit. However, the associations were weak, with odds ratios very close to unity. Choice of metrics of geographic access to general practices did not alter the associations with smoking during pregnancy or late first antenatal visit.
Conclusion: GIS can be used to quantify measures of geographic access to health services for public health and health services research. Geographic access to general practices was generally not associated with smoking during pregnancy or late first antenatal visit. GIS and routinely collected health data can be used to answer novel questions in public health and health services research.
Full text
Introduction
Routinely collected health data have been widely used in public health and health services research.1-3 Routinely collected data have the advantages of being relatively cost-effective and easily accessible, allowing large sample sizes and – importantly – enabling whole populations to be studied. However, there are also some disadvantages to using routinely collected health data: they are often collected for administrative purposes rather than for research or health services planning, so may not be fit for purpose, and there may be no or limited information on potential confounders, effect modifiers and other variables of interest.
Use of geographic information systems (GIS) in public health and health services research, and particularly in environmental health, is a recent development.4,5 The potential uses of GIS in health include simple mapping of diseases, identifying associations between exposures and spatial distribution of disease, estimating exposures in individuals within defined geographic regions, identifying populations at risk for environmental hazards, and identifying disease clusters.6 However, the use of GIS in health is not new. An early example of geomapping use was John Snow’s investigation of the 1854 cholera outbreak in London.7 Snow mapped households where cholera deaths had occurred, as well as the location of water pumps that provided potable water to those households, and demonstrated that most deaths were clustered around one water pump − the Broad Street pump.
Efficient and equitable access to health services is important for individuals and communities. Geographic access is one of many dimensions of access to health services. Commonly used geographic access metrics are proximity (or distance) and density. Two widely used proximity metrics are Euclidean (straight line between two points) and road network (the shortest possible route between two points along the road network) distances. Density metrics are calculated using spatial buffers – for example, the number of general practices within a certain radius of a residence. A circular buffer is simple to compute, whereas a road network buffer is more computationally intensive.
Antenatal care early in pregnancy is important for ultrasound assessment of gestational age, and providing information about nutritional supplements (e.g. folic acid supplementation) and screening programs (e.g. for Down syndrome and haemoglobinopathies).8,9 Smoking during pregnancy is associated with a higher risk of growth restriction, low birthweight and orofacial clefts.10
In this feasibility study, we used routinely collected health data (perinatal data) and GIS to demonstrate how geographic metrics of access to general practices can be used in public health and health services research. We investigated associations between proximity and density metrics of geographic access to general practices, and late first antenatal visit and smoking during pregnancy. We hypothesised that increased geographic access to general practitioners before and during pregnancy would lead to early consultations and lower rates of smoking during pregnancy.
Methods
Maternal and infant data
We obtained the Perinatal Data Collection (PDC), 2004−2008, for South Western Sydney Local Health District (SWSLHD) from the New South Wales (NSW) Ministry of Health. SWSLHD is about 6231 km2 in area, with seven local government areas and, in 2011, had a population of 840 602.
The PDC is a population-based surveillance system of all live births and stillbirths of at least 20 weeks gestation or birthweight of at least 400 g. We obtained information on maternal demographic characteristics (age, country of birth), pregnancy, labour, delivery, the newborn (birthweight, gestational age), number of cigarettes smoked during second half of pregnancy, duration of gestation at first antenatal visit, plurality, parity and mother’s residential address. First antenatal visit was categorised into <14 weeks and ≥14 weeks (late first antenatal visit) gestation.10 Smoking during second half of pregnancy was categorised as ‘yes’ (any smoking) and ’no’. A validation study of PDC against information from medical records showed low rates of missing data, and high levels of agreement for pregnancy duration at first antenatal visit and smoking during pregnancy.11 A previous study of women attending antenatal clinics in south western Sydney demonstrated good agreement between self-reported smoking status and smoking status classified by urinary cotinine levels.12
Area socio-economic deprivation
We used the 2006 Index of Relative Socio-economic Disadvantage (IRSED) at the census collection district (CCD) level in the analyses as an ecological measure of area deprivation.11 The IRSED was categorised into tertiles − tertile 1 was designated as most disadvantaged, tertile 2 as middle disadvantaged and tertile 3 as least disadvantaged. All women were assigned an IRSED based on CCD residential address.
Access to general practitioners
We used density (number of general practices within buffers) and proximity (distance by road network to general practices) measures as proxies for geographic access to general practitioners.
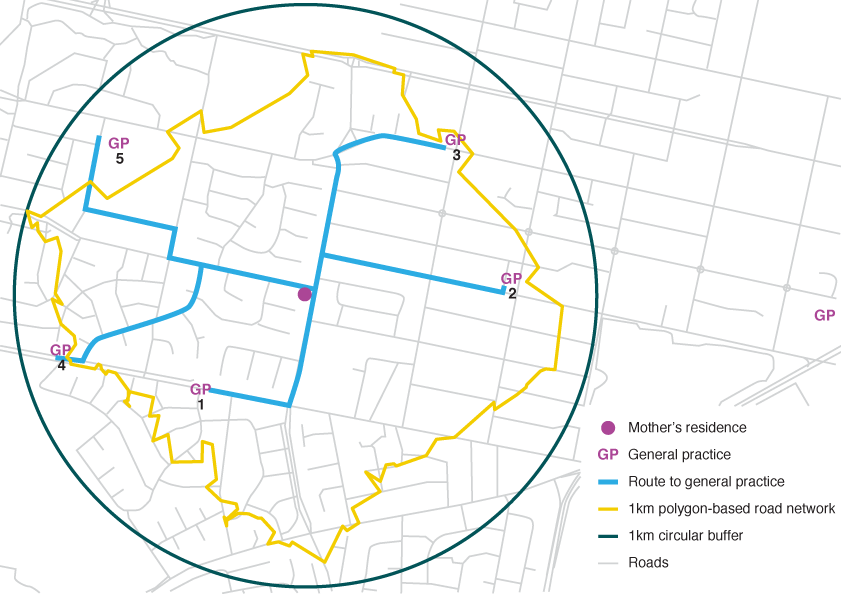
General practice addresses, provided by the NSW Ministry of Health, were geocoded, and then ArcGIS v10 (Esri Australia) was used to generate metrics for access to general practices. These metrics were number of general practices within 1 km and 2 km circular buffers (CBs) around mothers’ residences, number of general practices within 1 km and 2 km polygon-based road network buffers (PRNBs) around mothers’ residences, and average distance from mothers’ residences to the five closest general practices. The PRNBs were created using the StreetPro Navigation (PitneyBowes Inc., US) road network file and an ArcGIS network analyst to calculate the endpoints of all possible routes up to the specified distance (1 km or 2 km) along the road network for each mother’s residence. The endpoints were then connected to form irregular polygons. Using the same StreetPro Navigation file, the distance to the five closest general practices from each mother’s residential address was computed using an ArcGIS network analyst.
In the example shown in Figure 1, there are five general practices within the 1 km CB and three general practices within the 1 km PRNB. The five closest general practices from the mother’s residence are shown, with 1 indicating the closest general practice and 5 indicating the furthest. ArcGIS was also used to generate kernel density surface maps.
Figure 1. Measures of geographic access to general practices (click to enlarge)
Statistical analysis
We used the Wilcoxon signed-rank test to examine differences in the number of general practices between CBs and PRNBs, and the Kruskal–Wallis test to compare the number of general practices within buffers by smoking status and late first antenatal visit. We used generalised estimating equations (GEE) logistic regression to assess associations between access to general practices, and smoking during pregnancy and late first antenatal visit. The final model adjusted for maternal age, whether the mother was born in Australia (yes/no), plurality (yes/no), first pregnancy (yes/no), population density within the buffers and area deprivation. Results from GEE models are presented as odds ratios (ORs), together with their 95% confidence intervals (95% CI). All analyses were conducted using Proc Genmod in SAS v9.4 (SAS Institute Inc., Cary, NC).
This study was approved by the NSW Population and Health Services Research Ethics Committee.
Results
Between 2004 and 2008, there were 63 074 births in SWSLHD. Most women were aged between 20 and 34 years (79.1%), 44% were born overseas, and most delivered a singleton infant (97.2%) (Table 1). Twelve per cent (n = 7649) smoked during pregnancy, and 33% (n = 21 067) had a late first antenatal visit (≥14 weeks).
Table 1. Smoking during pregnancy and late first antenatal visit by maternal characteristics, 2004−2008
| Smoking during pregnancy | Late first antenatal visit | |||||||
| Maternal characteristic | n | % | OR | 95% CI | % | OR | 95% CI | |
| Age group (years) | <20 | 2 373 | 28.0 | 2.54 | 2.22, 2.89 | 53.9 | 2.37 | 2.13, 2.63 |
| 20–35 | 49 869 | 12.0 | 1.18 | 1.10, 1.27 | 34.0 | 1.14 | 1.09, 1.19 | |
| >35 | 10 832 | 9.9 | 1.00 | na | 31.0 | 1.00 | na | |
| Country of birth | Australia | 35 135 | 17.3 | 3.09 | 2.81, 3.41 | 28.0 | 0.64 | 0.61, 0.67 |
| Overseas | 27 939 | 5.9 | 1.00 | na | 42.2 | 1.00 | na | |
| IRSEDa | Most disadvantaged | 20 986 | 13.3 | 1.46 | 1.21, 1.76 | 42.9 | 2.39 | 2.19, 2.61 |
| Middle disadvantaged | 20 704 | 12.6 | 1.40 | 1.22, 1.61 | 31.5 | 1.32 | 1.13, 1.55 | |
| Least disadvantaged | 20 868 | 10.7 | 1.00 | na | 23.2 | 1.00 | na | |
| Plurality | Yes | 1 772 | 12.6 | 1.00 | na | 27.6 | 1.00 | na |
| No | 61 302 | 12.2 | 0.99 | 0.81, 1.19 | 34.4 | 1.32 | 1.13, 1.55 | |
| Previous pregnancyb | Yes | 39 275 | 13.6 | 1.35 | 1.29, 1.42 | 35.8 | 1.20 | 1.16, 1.25 |
| No | 23 799 | 9.9 | 1.00 | na | 31.7 | 1.00 | na | |
95% CI = 95% confidence interval; IRSED = Index of Relative Socio-economic Disadvantage; na = not applicable; OR = odds ratio
a Data missing for 521 women
b Data missing for 422 women
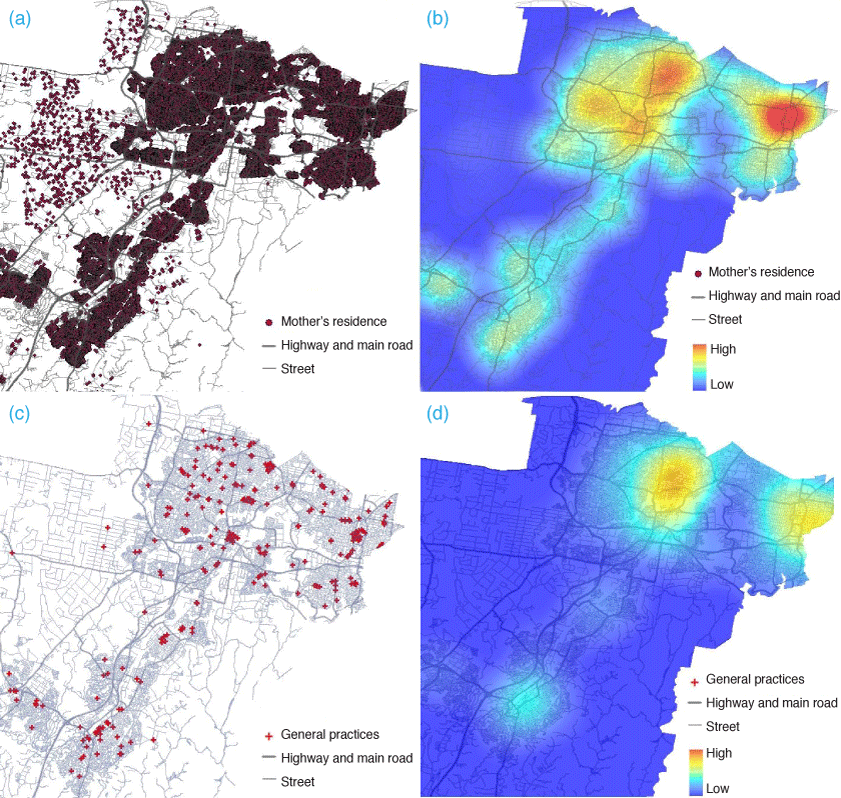
Figures 2a and 2c are maps of the study’s more densely populated area, with the location of mothers’ residences and general practices, respectively. Figures 2b and 2d show the same information following kernel density estimation. Red areas indicate greater numbers of maternal residences (and hence births) and general practices; blue areas indicate fewer births and general practices.
Figure 2. (a) Mother’s residence at birth; (b) kernel density map of mother’s residence at birth; (c) location of general practices; (d) kernel density map of general practices (click to enlarge)
The mean number of general practices was 5.3 ± 8.4 (median 2, range 0−48) within the 1 km CBs and 14.9 ± 14.5 (median 10, range 0−73) within the 2 km CBs. For the 1 km PRNBs, the mean number of general practices was 2.9 ± 6.0 (median 1, range 0−43); for the 2 km PRNBs, the mean was 9.7 ± 11.7 (median 6, range 0−55). The number of general practices within CBs was significantly higher than within PRNBs (p < 0.0001 for all buffer sizes). The average distance of the five closest general practices to a mother’s residence was 2.3 km ± 3.0 km (median 1.4 km, range 0.05−40.0 km).
Women who smoked during pregnancy had significantly fewer general practices in their neighbourhood and longer average distances to the closest five general practices than those who did not smoke during pregnancy (Table 2). Conversely, mothers who delayed their first antenatal visit had significantly more general practices close to where they lived and shorter average distances to the closest five general practices (Table 2).
Table 2. Access to general practices by buffer type and outcome variables
| Smoking during pregnancy | Late first antenatal visit | |||||||
| Yes | No | Yes | No | |||||
| Access to general practices | Mean ± SD | Median (range) | Mean ± SD | Median (range) | Mean ± SD | Median (range) | Mean ± SD | Median (range) |
| Number of general practices within 1 km CB |
3.9 ± 6.3 | 2.0 (0−47) | 5.5 ± 8.7 | 3.0 (0–48) | 6.5 ± 9.5 | 3.0 (0–48) | 4.6 ± 7.7 | 2.0 (0–48) |
| Number of general practices within 1 km PRNB |
2.1 ± 4.3 | 1.0 (0–43) | 3.0 ± 6.2 | 1.0 (0–43) | 3.7 ± 6.8 | 1.0 (0–43) | 2.5 ± 5.5 | 1.0 (0–43) |
| Number of general practices within 2 km CB |
12.3 ± 12.5 | 8.0 (0–73) | 15.3 ± 14.8 | 10.0 (0–73) | 17.8 ± 15.6 | 12.0 (0–73) | 13.3 ± 13.7 | 9.0 (0–73) |
| Number of general practices within 2 km PRNB |
7.6 ± 9.6 | 5.0 (0–51) | 10.0 ± 12.0 | 6.0 (0–55) | 11.8 ± 12.9 | 7.0 (0–54) | 8.5 ± 10.9 | 5.0 (0–55) |
| Distance to closest five general practices (km) | 2.5 ± 3.1 | 1.5 (0–24.4) | 2.2 ± 2.9 | 1.4 (0–40.0) | 1.9 ± 2.5 | 1.2 (0–28.9) | 2.5 ± 3.2 | 1.5 (0–40.0) |
CB = circular buffer; PRNB = polygon-based road network buffer; SD = standard deviation
Note: p-values were <0.0001 using the Kruskal–Wallis test for smoking during pregnancy and late first antenatal visit for all metrics of geographic access to general practices.
After adjusting for potential confounders, although the ORs were greater than 1, the associations between access to general practices and smoking during pregnancy were not significant, and all were close to unity (Table 3). The association between access to general practices and late first antenatal visit showed an unfavourable effect, with a higher number of general practices associated with an increased risk for late first antenatal visit. This was significant for the 1 km PRNB and the distance measure (Table 3).
Table 3. Adjusted odds ratios for smoking during pregnancy and late first antenatal visit
| Smoking during pregnancy | Late first antenatal visit | |||
| Access to general practices | Unadjusted OR (95% CI) | Adjusted OR (95% CI) | Unadjusted OR (95% CI) | Adjusted OR (95% CI) |
| Number of general practices within 1 km CB |
0.988 (0.981, 0.995)** | 0.996 (0.988, 1.0041) | 1.016 (1.009, 1.022)*** | 1.005 (1.000, 1.009) |
| Number of general practices within 2 km CB |
0.992 (0.987, 0.997)** | 0.998 (0.991, 1.005) | 1.017 (1.014, 1.020)*** | 1.003 (0.999, 1.006) |
| Number of general practices within 1 km PRNB |
0.990 (0.983, 0.997)** | 0.998 (0.990, 1.005) | 1.012 (1.005, 1.019)** | 1.005 (1.000, 1.010)* |
| Number of general practices within 2 km PRNB |
0.994 (0.989, 0.999)* | 1.001 (0.995, 1.008) | 1.018 (1.015, 1.022)*** | 1.003 (1.000, 1.007) |
| Mean distance to closest five general practices (km) | 1.001 (0.987, 1.015) | 1.008 (0.994, 1.022) | 0.944 (0.933, 0.955)*** | 0.978 (0.969, 0.988)*** |
* p < 0.05, ** p < 0.01, *** p < 0.001
95% CI = 95% confidence interval; CB = circular buffer; OR = odds ratio; PRNB = polygon-based road network buffer
Note: Odds ratios were adjusted for maternal country of birth, maternal age, area deprivation, plurality, parity and population density.
Discussion
We used routinely collected health data and GIS in this study to demonstrate the feasibility of using metrics of geographic access to health services in public health and health services research. We used two GIS functionalities to quantify geographic access to general practices by density and proximity. Previous studies used simple CBs as density metrics to capture variables of interest.13,14 Although easy to implement in a GIS, this approach does not take into consideration the road network, and may include general practices that are not readily accessible by road. Therefore, we constructed PRNBs to generate more realistic buffers. However, not surprisingly, the numbers of general practices within CBs were significantly greater than within PRNBs. This is because CBs created using Euclidean distances have larger surface areas than PRNBs, and hence more general practices. We also used GIS functionality to adjust for population density in each buffer and generate a proximity metric (average road distance from a mother’s residential address to the closest five general practices) as a further proxy measure of access to primary health services.
Women who smoked during pregnancy had significantly fewer general practices close to their residence than women who did not smoke during pregnancy. This finding makes intuitive sense. However, a regression model showed no associations between the number of general practices and smoking during pregnancy. Women who delayed their first antenatal visit until ≥14 weeks gestation had more general practices in their vicinity than women who did not delay their first antenatal visit. In the adjusted regression model, these two associations to number of general practices in the vicinity remained significant. This was an unexpected finding because we had hypothesised that increased general practice numbers would mean greater access to general practitioners and hence visits earlier in pregnancy.
Our findings may have been unexpected but are not surprising. Our general practice metrics (density and proximity measures) are geographic or physical measures, and are only one component of accessibility to health services. Other important aspects include affordability, cultural acceptability and whether care is available when needed.15 The choice of which general practice to visit depends on many factors other than geographic access. For example, in the US, African Americans’ proximity to high-quality renal dialysis facilities did not lead to their receiving care at those facilities, and the study authors suggest that institutional and social barriers may play a role in health-seeking behaviour.16
We have demonstrated some relatively straightforward methods to calculate density and proximity measures in GIS as metrics for geographic access to general practitioners. With increasing sophistication of GIS software and computational hardware, car travel time on the road network (the quickest route between two points) is another geographic access metric for health services that is now being widely used.17 Travel time can also be used as a density measure – for example, for the number of general practices accessible within 30 minutes. GIS-calculated travel time is highly correlated with reported travel time (r = 0.86)17 and may be a more relevant metric than simple measures such as Euclidean or road network distance.18
We did not use travel time in our calculations. Fortney et al.19 have demonstrated that road distances to the closest health provider explain about 97% of variation in travel times to the closest health provider. In addition, travel time computation in GIS does not take into account unpredictable local conditions (such as traffic congestion and inclement weather) or temporal conditions (such as weekdays and weekends).18,20 It is open to question whether more resource-intensive and sophisticated travel time measures that incorporate traffic congestion and inclement weather are worthwhile.
There are some barriers (although not insurmountable ones) to using GIS. Its application in health research requires significant resources, technical skills and organisational commitment. Although some GIS software is freely available, it may have limited functionality, so may not be fit for purpose. GIS software with full functionality can be expensive to purchase and maintain. Further, application of network analysis on large datasets can be computationally intensive, requiring high-end, expensive computer hardware. High-level skills are required in preparing, exploring, modelling and presenting the data.21 In addition, access to address information or geocoded data is often denied (rightly or wrongly) because of the need to preserve confidentiality.
One limitation of our study is that we calculated geographic access to general practices, rather than access to general practitioners themselves, as measures of access to primary healthcare. Large group practices (five or more general practitioners per practice)22 are more common than solo or smaller group practices, and it would have been important to adjust for this. Unfortunately, we did not have the necessary information. Another potential limitation is that we measured geographic access to general practices from the mother’s residence. Women may have visited general practices closer to their place of employment. A common assumption in studies investigating geographic access to health services is that people will use health services closest to where they live or work, but this may not necessarily be true. For example, in England, only 56% of the population in three counties were registered with their nearest general practitioner.23
There can be limitations to using routinely collected data in a study exploring geographic access to general practices and antenatal factors. Maternity units may or may not include visits to general practitioners for antenatal care in their definition of ‘gestational age at first antenatal visit’, so this variable may not be reported consistently across maternity hospitals. Further, hospital factors, such as lack of resources, may be the cause of late first antenatal visits, rather than women choosing to delay antenatal visits. Finally, although not a study limitation, it should be noted that, because of the large number of subjects in our study, small differences, whether meaningful or not, are likely to be statistically significant.
Conclusion
This study aimed to demonstrate the feasibility of using metrics of geographic access to health services in public health and health services research. We used a number of GIS functionalities to quantify density and proximity metrics of access to general practices to determine whether geographic access to general practitioners was associated with smoking during pregnancy and late first antenatal visit. There were generally no, or only weak, associations between geographic access and smoking during pregnancy or late first antenatal visit. The choice of metrics of geographic access to general practices did not alter the associations with smoking during pregnancy or late first antenatal visit. Advances in statistical methods and GIS, as well as increased availability of routinely collected data, have the potential to contribute to our understanding of the relationship between geographic access to health services and health outcomes.
Acknowledgements
The authors would like thank the Centre for Epidemiology and Evidence, NSW Ministry of Health, for providing the birth data for the study and for approval to publish the manuscript.
Copyright:

© 2015 Chong et al. This article is licensed under the Creative Commons Attribution-NonCommercial-ShareAlike 4.0 International Licence, which allows others to redistribute, adapt and share this work non-commercially provided they attribute the work and any adapted version of it is distributed under the same Creative Commons licence terms.
References
- 1. Chong S, Nelson M, Harris L, Eastwood J, Jalaludin B. Geospatial analyses to identify clusters of adverse antenatal factors for targeted interventions. Int J Health Geogr. 2014;12:46. CrossRef | PubMed
- 2. Gallego B, Magrabi F, Concha PO, Wang Y, Coiera E. Insights into temporal patterns of hospital patient safety from routinely collected electronic data. Health Inf Sci Sys. 2015;3(Suppl 1).
- 3. Havard A, Jorm L, Lujic S. Risk adjustment for smoking identified through tobacco use diagnoses in hospital data: a validation study. PLoS One 2014;9:e95029. CrossRef | PubMed
- 4. Lyseen AK, Nohr C, Sorensen EM, Gudes O, Geraghty EM, Shaw NT et al. A review and framework for categorizing current research and development in health related geographical information systems (GIS) studies. Yearb Med Inform. 2014;9:110−24. CrossRef | PubMed
- 5. Nuckold JR, Ward MH, Jarup L. Using geographic information systems for exposure assessment in environmental epidemiology studies. Environ Health Perspect. 2004;112:1007−15. CrossRef | PubMed
- 6. Shaw NT. Geographic information systems and health: current state and future directions. Healthc Inform Res. 2012;18(2):88−96. CrossRef | PubMed
- 7. Lang L. GIS for health organizations. Redlands (CA): Environmental Systems Research Institute Inc; 2000.
- 8. Cresswell JA, Yu G, Bhatherall B, Morris J, Jamal F, Harden A et al. Predictors of the timing of initiation of antenatal care in an ethnically diverse urban cohort in the UK. BMC Pregnancy Childbirth. 2013;13:103. CrossRef | PubMed
- 9. Department of Health and Ageing. Clinical practice guidelines: antenatal care − module I. Canberra: Commonwealth of Australia; 2012 [cited 2015 Aug 19]. Available from: www.health.gov.au/internet/main/publishing.nsf/content/015FBFDD266795DBCA257BF0001A0547/$File/ANC_Guidelines_Mod1_v32.pdf
- 10. NSW Health. NSW mothers and babies 2012. Sydney: NSW Ministry of Health; 2014 [cited 2015 Aug 19]. Available from: www.health.nsw.gov.au/hsnsw/Publications/mothers-and-babies-2012.pdf
- 11. Australian Bureau of Statistics. 2001 census of population and housing − geographic areas. Canberra: ABS; 2006 [cited 2015 Aug 19]. Available from: www.abs.gov.au/AUSSTATS/[email protected]/DetailsPage/2033.0.55.0012006?OpenDocument
- 12. Mohammed M, Forero R, Berthelsen A, Bauman A, Jalaludin B, Gyaneshwar R. Social Influences for smoking in pregnancy in south western Sydney antenatal clinic attendees. Aust N Z J Obstet Gynaecol. 2007;47:207−12. CrossRef | PubMed
- 13. An R, Sturm R. School and residential neighborhood food environment and dietary intake among California youth. Am J Prev Med. 2012;42(2):129−35. CrossRef | PubMed
- 14. van den Berg AE, Maas J, Verheij RA, Groenewegen PP. Green space as a buffer between stressful life events and health. Soc Sc Med. 2010;70(8):1203−10. CrossRef | PubMed
- 15. Penchansky R, Thomas JW. The concept of access: definition and relationship to consumer satisfaction. Med Care. 1981;19(2):127−40. CrossRef | PubMed
- 16. Saunders MR, Lee H, Maene C, Schuble T, Cagney KA. Proximity does not equal access: racial disparities in access to high quality dialysis facilities. J Racial Ethn Health Disparities. 2014;1(4):291−9. CrossRef | PubMed
- 17. Haynes R, Jones A, Sauerzapf V, Zhao H. Validation of travel times to hospital estimated by GIS. Int J Health Geographics 2006;5:40. CrossRef | PubMed
- 18. Shahid R, Bertazzon S, Knudtson M, Ghali W. Comparison of distance measures in spatial analytical modeling for health service planning. BMC Health Ser Res. 2009;9:200. CrossRef | PubMed
- 19. Fortney J, Rost K, Warren J. Comparing alternative methods of measuring geographic access to health services. Health Serv Outcomes Res Methodol. 2000;1(2):73−84.
- 20. Brabyn L, Gower P. Comparing three GIS techniques for modelling geographical access to general practitioners. Cartographica. 2004;39(2):41−9. CrossRef
- 21. Green C. Geographic information systems and public health: benefits and challenges. Purple paper. Winnipeg (MB): National Collaborating Centre for Infectious Diseases; 2012 [cited 2015 Aug 19]. Available from: www.nccid.ca/files/Purple_Paper_Note_mauve/PP_37_EN.pdf
- 22. Britt H, Miller GC, Henderson J, Bayram C, Valenti L, Harrison C, et al. A decade of Australian general practice activity 2004–05 to 2013–14. General practice series no. 37. Sydney: Sydney University Press; 2014 [cited 2015 Aug 19]. Available from: ses.library.usyd.edu.au/handle/2123/11883
- 23. Haynes R, Lovett A, Sunnenberg G. Potential accessibility, travel time, and consumer choice: geographic variations in general practice registrations in Eastern England. Environment and Planning A. 2003;35:1733−50. CrossRef