Abstract
Objective: To analyse routinely collected data from a hospital database of drug health consultation-liaison (CL) assessments. We aimed to investigate changes in psychostimulant-related health service demand in an inner-city hospital to inform the development of locally appropriate models of care.
Methods: We used de-identified drug health CL service data from 2012 to 2015. Psychostimulant-related consultations and admissions were compared with opioid-related consultations and admissions over time, by sex and by ward type (medical units, mental health units or emergency department).
Results: The CL service collected information on 8800 consultations and 4405 hospital admissions from 2012 to 2015. Psychostimulant use was responsible for 684 (7.8%) consultations and 372 (8.4%) admissions. Opioids were related to 1914 (21.8%) consultations and 864 (19.6%) admissions. Psychostimulants were the subject of three times more consultations in 2015 than in 2012, and more than twice as many admissions. Time trend analysis showed a significant time effect for consultations and admissions relating to psychostimulants. Conversely, no significant changes were observed in consultations and admissions relating to opioids.
Conclusion: This study identified a rapid rise in the demand for psychostimulant-related inpatient assessments, suggesting the use of these drugs has increased locally. Because of the impact on the public health system, there is a need to invest in and implement new treatment strategies and services for psychostimulant users.
Full text
Introduction
In Australia1 and worldwide2, it has been claimed that methamphetamine use and its harmful3,4 consequences may have reached ‘epidemic’ levels.5 The United Nations Office on Drugs and Crime (UNODC) estimated that more than 73 million people, or 1.58% of the global population, were using psychostimulants in 2014.6 The main drugs defined as psychostimulants are cocaine, amphetamine-type stimulants and 3,4-methylenedioxymethamphetamine (ecstasy). As described in UNODC’s World drug report 20166, Oceania had the highest global prevalence of psychostimulant use. In 2014, it was estimated that 1.5% of the Oceania population used cocaine, 1.9% used amphetamine-type drugs and 2.4% used ecstasy.6
According to the National Drug Strategy Household Survey detailed report 20137, 8.1% of survey respondents (which extrapolates to 1.5 million Australians) had used cocaine in their lifetime, and 2.1% (400 000) had consumed it in the previous 12 months. However, there was no increase in the prevalence of use compared with the 2010 survey. In the 2013 report, ecstasy was the second most consumed illicit drug in a person’s lifetime in Australia. The estimated population prevalence of amphetamine-type stimulants in Australia has remained stable over the past few years: in 2013, 7.0% of people reported using these drugs at least once in their life, and 2.1% reported use in the past 12 months in 2010 and 2013.7 Although there had been a decrease in the use of lower purity forms of the drug (such as powder), from 51% in 2010 to 29% in 2013, it is concerning that the use of more pure forms (such as crystalline methamphetamines or ‘ice’) had increased from 12.4% in 2010 to 25.3% in 2013. Also, in addition to the massive rise in the number of ice seizures at Australian borders (more than 5 tonnes were seized between 2010 and 2015), the median purity of methamphetamines increased from 17% in 2010–11 to 62% in 2013–14.8 The rapid growth in the quantity and purity of the available methamphetamines, and the observed increase in associated harms3, resulted in the establishment of the National Ice Taskforce.8 The aim of the taskforce was to develop a coordinated political response at national and state and territory levels, and to produce a set of evidence based recommendations and strategies to address methamphetamine use and its consequences.
In 2011–12, New South Wales (NSW) surveillance data shows that 1215 people aged 16 years or older presented to a public hospital emergency department (ED) because of methamphetamine use.9 In 2015–16, the number increased significantly to 4903.9 In 2014–15, 0.2% of all NSW hospitalisations were related to methamphetamine use.10 From 2009 to 2016, there was an almost 10-fold increase in methamphetamine-related overdoses, drug and alcohol, or mental health presentations to EDs in NSW.9 These data possibly reflect an increase in harms associated with amphetamine-type drugs, because of the increased purity, frequency of use and mode of administration.
To inform the development of locally based, targeted public health interventions, as recommended by the National Ice Taskforce8, we analysed routinely collected data to examine whether patterns in psychostimulant-related hospital consultations and admissions at an inner-city hospital were consistent with other state, national and global data. Specific aims included: 1) to examine whether there had been an increase in psychostimulant-related consultations and hospitalisation between 2012 and 2015; 2) to analyse trends of psychostimulant-related events over the 2012–2015 period; and 3) to assess the impact of psychostimulant use on the NSW drug health consultant-liaison (CL) service.
Methods
Study design, setting, participants and data
Data were obtained from the drug health CL service11 in a large metropolitan teaching hospital where more than 1000 patients are treated each day. We conducted a retrospective analysis of routinely collected inpatient data, which included all patients assessed from January 2012 to December 2015. Each consultation was defined as an encounter between a patient and the drug health CL team (nursing or medical staff). Patients could have multiple consultations in one admission. The extracted data were de-identified except for medical record number (MRN), which was required to analyse hospital presentation rates, frequency of assessments per patient and control for possible subject effects in the trend analysis.
Variables and statistical methods
Each consultation or admission was coded according to the primary drug that resulted in the request for an assessment by the drug health CL team. Only one drug type could be nominated in the dataset per encounter. The primary drug variable was defined by the clinician’s evaluation and later recoded in this study in the same grouping classification used by the Diagnostic and statistical manual of mental disorders, 5th edition.12 The psychostimulant-related category included consultations relating to cocaine, ecstasy, amphetamine-type stimulants and other nonclassified stimulants, although the proportion of each could not be determined. Opioid-related presentations were selected as a comparison group and included heroin, methadone, codeine and other opioids. Wards were reclassified to three different subgroups: mental health units (e.g. high-dependency unit, short-stay unit, adult inpatient unit), medical units (e.g. orthopaedics, cardiology, maternity) and the ED. Key demographic variables were age and gender.
Data were analysed using SPSS for Windows (Armonk, NY: IBM Corp, Version 22.0). For the primary analysis, we examined whether the proportion of psychostimulant- and opioid-related consultations and admissions changed between 2012 and 2015. Student t-tests were conducted to assess changes in age, and chi-square tests used to assess changes in gender and ward.
We used generalised linear models with generalised estimating equations to analyse time trends, and adjusted for repeated observations. The MRN was considered to be the repeated variable in this binary logistic model, where drug (‘opioids’ and ‘psychostimulants’) was the dependent variable (present or absent). For consultations, the predictor factors were gender and ward, and time was a covariate. For admissions, the ward variable was not useful because most patients had been in more than one ward during their hospitalisation, although the same tests using gender and time were performed as above.
Ethical approval
The Human Research Ethics Committee of the Royal Prince Alfred Hospital Zone approved this study (HREC/RPAH Zone – X16-0259 and LNR/16/RPAH/320). This research did not require patients’ individual consent.
Results
Primary analysis
Between 2012 and 2015, the drug health CL service collected information on 8800 consultations and 4405 hospital admissions from inpatient assessments conducted throughout the hospital. Alcohol was responsible for the highest number of CL assessments, with 4604 (52.3%) consultations and 2325 (52.8%) admissions. Opioids accounted for the second highest number of consultations (n = 1914, 21.8%) and admissions (n = 864, 19.6%). Psychostimulants were the third most common drug, accounting for 684 (7.8%) consultations and 372 (8.4%) admissions. Most patients had only one admission to the hospital for opioid-related presentation (in 78.3% of cases) and/or one admission for psychostimulants (in 88.4% of cases) during the study period.
Consultation and admission data analyses are described in Tables 1 and 2. Overall, 58% of drug health evaluations occurred in medical units, 13.5% in mental health units and 24.0% in the ED. A total of 4.5% of consultations were missing a ward classification, which did not significantly affect the results. Chi-square tests comparing mental health units, medical units and the ED for each drug subgroup were performed for consultation data of 2012 compared with 2015 (Table 1). Analysing all ward types conjointly did not reveal a significant change for opioids over time (p = 0.232) but did reveal a significant effect for psychostimulants (p < 0.0001). In 2012, out of 2193 hospital drug health evaluations, there were 180 assessments in mental health units; in 2015, there were 2309 assessments across the hospital, with 682 conducted in mental health units.
Table 1. Comparison of consultation data in 2012 and 2015
| Drug type | Data type | 2012 | 2015 | p value |
| All drugs | Total consultations (n) | 2 348 | 2 412 | na |
| Psychostimulants | Total consultations, n (%) | 96 (4.1) | 321 (13.3) | p < 0.0001 |
| Mean age (years ± standard deviation) | 35.17 ± 9.44 | 36.24 ± 10.39 | p = 0.369 | |
| Male, n (%) | 44 (45.8) | 198 (61.7)a | p < 0.0001 | |
| Female, n (%) | 52 (54.2) | 122 (38.0)a | p < 0.0001 | |
| Mental health units, n (%) | 36 (20.0) | 167 (24.5) | p = 0.207 | |
| Medical units, n (%) | 26 (1.8) | 107 (8.0) | p < 0.0001 | |
| Emergency department, n (%) | 29 (5.3) | 29 (10.0) | p = 0.012 | |
| Opioids | Total consultations, n (%) | 570 (24.3) | 536 (22.2) | p = 0.093 |
| Mean age (years ± standard deviation) | 39.80 ± 10.95 | 43.93 ± 11.59 | p < 0.0001 | |
| Male, n (%) | 294 (52.1) | 293 (54.7) | p = 0.615 | |
| Female, n (%) | 276 (47.9) | 243 (45.3) | p = 0.056 | |
| Mental health units, n (%) | 50 (27.8) | 77 (11.3) | p < 0.0001 | |
| Medical units, n (%) | 375 (25.5) | 405 (30.3) | p = 0.050 | |
| Emergency department, n (%) | 99 (18.2) | 35 (12.1) | p = 0.022 |
na = not applicable
a One patient was not identified as male or female
Table 2. Comparison of admission data in 2012 and 2015
| Drug type | Data type | 2012 | 2015 | p value |
| All drugs | Total admissions (n) | 1 134 | 1 069 | na |
| Psychostimulants | Total admissions, n (%) | 60 (5.3) | 141 (13.2) | p < 0.0001 |
| Mean age (years ± standard deviation) | 34.17 ± 9.18 | 35.57 ± 10.21 | p = 0.360 | |
| Male, n (%) | 32 (53.3) | 87 (61.7)a | p < 0.0001 | |
| Female, n (%) | 28 (46.7) | 53 (37.6)a | p = 0.003 | |
| Opioids | Total admissions, n (%) | 240 (21.2) | 221 (20.7) | p = 0.777 |
| Mean age (years ± standard deviation) | 40.57 ± 11.65 | 44.23 ± 11.91 | p = 0.001 | |
| Male, n (%) | 138 (57.5) | 131 (59.3) | p = 0.751 | |
| Female, n (%) | 102 (42.5) | 90 (40.7) | p = 0.393 |
na = not applicable
a One patient was not identified as male or female
Time trends
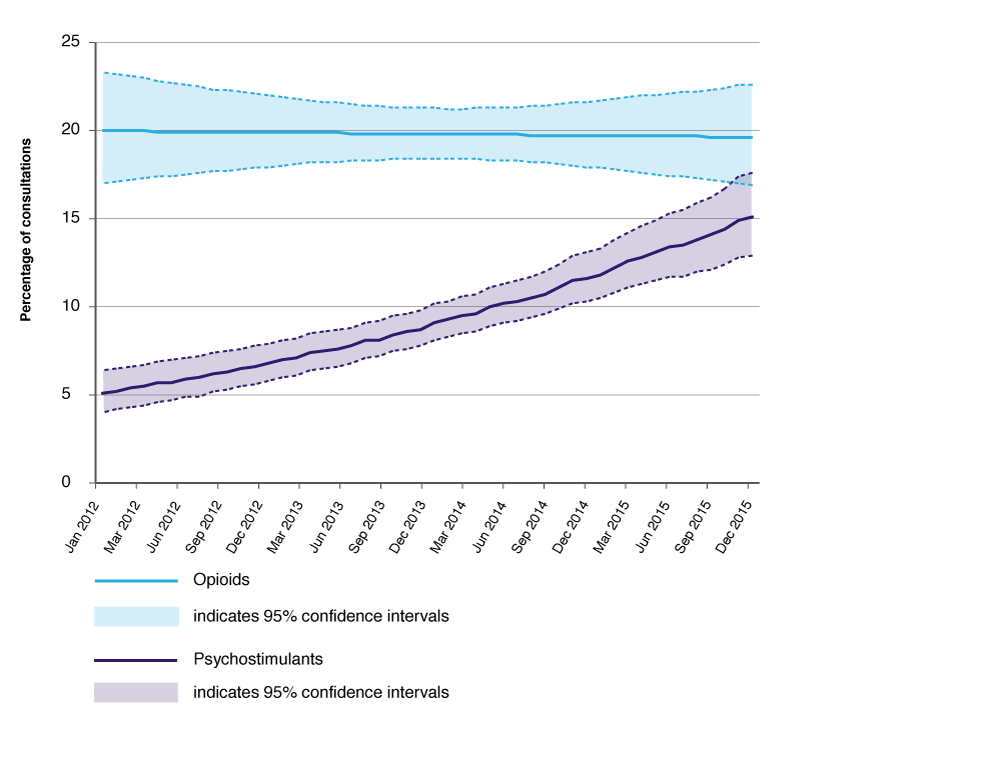
Figure 1 shows that psychostimulant consultations significantly increased over time (p < 0.0001) but consultations for opioids did not (p = 0.105). Gender did not influence change over time for psychostimulants (p = 0.276) or for opioids (p = 0.079). However, there was a significant interaction effect of time and ward for both drugs (p < 0.0001).
Figure 1. Psychostimulants and opioids as a proportion of consultations, 2012–2015 (click to enlarge)
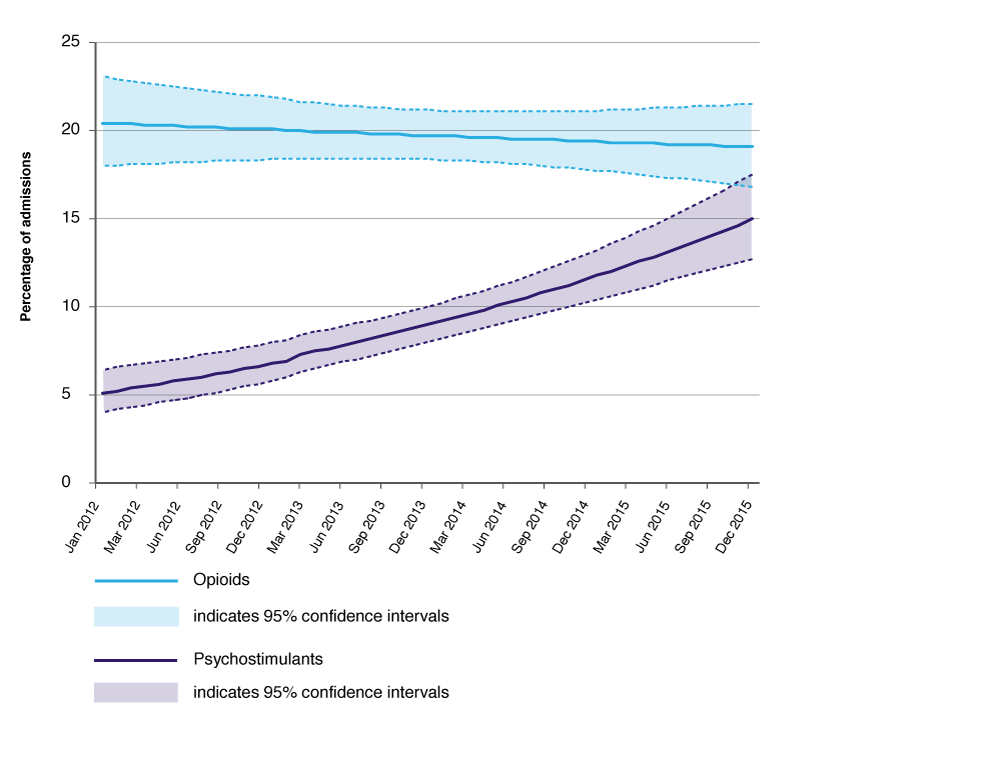
Hospital admission data (Figure 2) revealed a statistically significant effect for psychostimulants over time (p < 0.0001) but no interaction between time and gender (p = 0.772). Opioids had no significant statistical effects either for time (p = 0.676) or for the interaction between time and gender (p = 0.129).
Figure 2. Psychostimulants and opioids as a proportion of hospital admissions, 2012–2015 (click to enlarge)
Discussion
Our findings indicate that the growing impact of psychostimulant use on public hospital services can be observed locally. Psychostimulant-related consultations and admissions increased significantly from 2012 to 2015. In addition, the significant changes in ward characteristics, especially in the ED and medical units, demonstrate the impact of psychostimulants on specific health services. A three-fold increase in consultations in such a short period of time suggests the need for urgent interventions. These findings are consistent with previous results showing the contribution to the burden of disease and harm associated with psychostimulants.2,3,10 In Australia in 2013–14, Degenhardt13 estimated that 2.09% of people aged 15–54 were regular users of methamphetamines, and 1.24% were dependent users.
Hospital-based CL services are beneficial to the health system. They prevent poorer outcomes in emergency admissions, reduce the average length of stay and re-presentation rates at EDs, and decrease overall admission rates over time.14 Additionally, the high rates of single consultations for psychostimulant users per admission suggest a limited timeframe for intervention in which efficient engagement techniques are required. The increase in psychostimulant consultations may also indicate that referral teams have been able to screen and consider a drug health assessment as an important feature for the patient’s recovery. Liaison activities are critical to improving and developing training for health staff across the hospital.
Research using routinely collected data has several limitations.15 Firstly, the information was collected and developed with a clinical purpose, not to answer a specific research question. Although it could represent a reduction in attrition and expectation bias, it also increases the risk of misclassification and missing information. In addition, data were restricted to drug health CL assessments, so generalisability is restricted and the results do not include all psychostimulant events in the hospital. An uncertain proportion of patients requiring psychostimulant-related assessment were not assessed by drug health CL services, either because they were rapidly discharged or because the local treating team did not request a CL evaluation. Also, the classification relied on the ‘drug category’ variable, which does not include secondary drugs and therefore underestimates the number of patients using psychostimulants. Finally, the classification of psychostimulants does not directly indicate that methamphetamines have been responsible for the increase in patient presentations but, in accordance with current knowledge, it is likely that methamphetamine use is the cause of this time trend change.
Conclusion
Our research shows the increased impact of psychostimulant use on consultations, and that opioid consultations have remained stable over time. The study suggests that there is an urgent need to design and improve services for patients who use psychostimulants.
Copyright:

© 2018 Faingold et al. This work is licensed under a Creative Commons Attribution-NonCommercial-ShareAlike 4.0 International Licence, which allows others to redistribute, adapt and share this work non-commercially provided they attribute the work and any adapted version of it is distributed under the same Creative Commons licence terms.
References
- 1. Lim MS, Cogger S, Quinn B, Hellard ME, Dietze PM. 'Ice epidemic'? Trends in methamphetamine use from three Victorian surveillance systems. Aust N Z J Public Health. 2015;39(2):194–5. CrossRef | PubMed
- 2. Chomchai C, Chomchai S. Global patterns of methamphetamine use. Curr Opin Psychiatry. 2015;28(4):269–74. CrossRef | PubMed
- 3. Degenhardt L, Sara G, McKetin R, Roxburgh A, Dobbins T, Farrell M, et al. Crystalline methamphetamine use and methamphetamine-related harms in Australia. Drug Alcohol Rev. 2016. CrossRef | PubMed
- 4. Fulde GW, Forster SL. The impact of amphetamine-type stimulants on emergency services. Curr Opin Psychiatry. 2015;28(4):275–9. CrossRef | PubMed
- 5. Lancaster K, Ritter A, Colebatch H. Problems, policy and politics: making sense of Australia's 'ice epidemic'. Policy Studies. 2014;35(2):147–71. CrossRef
- 6. United Nations Office on Drugs and Crime. World drug report 2016. New York: UNODC; 2016 [cited 2016 Sep 20]. Available from: www.unodc.org/doc/wdr2016/WORLD_DRUG_REPORT_2016_web.pdf
- 7. Australian Institute of Health and Welfare. National drug strategy household survey detailed report 2013. Canberra: AIHW; 2014 [cited 2016 Sep 20]. Available from: www.aihw.gov.au/getmedia/c2e94ca2-7ce8-496f-a765-94c55c774d2b/16835_1.pdf.aspx?inline=true
- 8. Commonwealth of Australia, Department of the Prime Minister and Cabinet. Final report of the national ice taskforce. Canberra: DPMC; 2015 [cited 2016 Sep 20]. Available from: www.dpmc.gov.au/sites/default/files/publications/national_ice_taskforce_final_report.pdf
- 9. NSW Public Health Rapid, Emergency, Disease and Syndromic Surveillance (PHREDSS) system. Sydney: Centre for Epidemiology and Evidence, NSW Ministry of Health; 2018 [modified 2017 Jun 20; cited 2018 Feb 15]. Available from: www.healthstats.nsw.gov.au/Indicator/beh_illimethed/beh_illimethed_comparison
- 10. NSW Health. Crystalline methamphetamine: key messages. Sydney: NSW Ministry of Health; 2016 [cited 2018 Mar 8]. Available from: www.health.nsw.gov.au/crystallinemethamphetamine/Publications/key-messages.PDF
- 11. Saunders JB. A brief history of the development of consultation-liaison services in alcohol and drugs in New South Wales. North Sydney: NSW Department of Health; 2009:2. (Copy available from author).
- 12. Diagnostic and statistical manual of mental disorders. 5th ed. Washington, DC: American Psychiatric Association; 2013;481–589.
- 13. Degenhardt L, Larney S, Chan G, Dobbins T, Weier M, Roxburgh A, et al. Estimating the number of regular and dependent methamphetamine users in Australia, 2002–2014. Med J Aust. 2016;204(4):153. CrossRef | PubMed
- 14. Butler K, Reeve R, Viney R, Burns L. Estimating prevalence of drug and alcohol presentations to hospital emergency departments in NSW, Australia: impact of hospital consultation liaison services. Public Health Res Pract. 2016;26(4):e2641642. CrossRef | PubMed
- 15. Jorm L. Routinely collected data as a strategic resource for research: priorities for methods and workforce. Public Health Res Pract. 2015;25(4):e2541540. CrossRef | PubMed