Abstract
Aim: To estimate the impact of smoking-attributable cancer mortality on trends in cancer mortality in New South Wales (NSW), Australia, between 1972 and 2008.
Study type: The study is a retrospective analysis of cancer mortality in NSW using NSW Central Cancer Registry data.
Methods: Smoking-attributable cancer deaths were estimated using the smoking impact ratio method, which provides an indirect estimate of exposure to tobacco in the NSW population using lung cancer mortality. Trends in age-standardised cancer mortality rates by cancer type and the number of years of life lost due to smoking-attributable cancer deaths were estimated.
Results: In NSW, the cancer mortality rate decreased in males by 26% and females by 19% between 1989 and 2008. Nearly half (44%) of the decrease for males was a result of the decline in smoking-attributable cancer deaths. Despite a decline in the female all-cancer mortality rate, the smoking-attributable cancer mortality rate increased from 20.3 per 100 000 to 26.8 per 100 000 between 1989 and 2008. Smoking-attributable cancer deaths in women increased from around 150 per year in the early 1970s to 1186 in 2008; for men, the number remained stable at just over 2000 deaths per year since the 1980s. Although the lung cancer mortality rate declined in men, lung cancer remains the largest cause of cancer death. Lung cancer has overtaken breast cancer to be the largest cause of cancer death among women, with 17.1% (n = 998) of cancer deaths due to lung cancer in 2008.
Conclusions: Despite declining all-cancer mortality in NSW, around 3330 cancer deaths in 2008 were due to the accumulated hazard of smoking in current and ex-smokers. This highlights the importance of tobacco control as part of a comprehensive cancer control plan.
Full text
Introduction
Cancer was the largest cause of fatal disease burden (measured in years of life lost) in Australia in 2010, accounting for 35% of the fatal burden, followed by cardiovascular disease (23%). 1 Cancer overtook cardiovascular disease as the leading cause of disease burden (measured in disability-adjusted life years) in 2003 and is expected to remain the largest contributor to disease burden into the 2020s. 2 Tobacco smoking is the largest single preventable cause of cancer in Australia 2, and reducing tobacco consumption offers the potential to reduce cancer mortality.
In the mid-1940s, most Australian adult males were smokers (72%) compared with one-quarter of women (26%).3 Although smoking prevalence among men has declined since then, smoking prevalence among women increased, peaking at around 33% in 1976.3 In New South Wales (NSW), a continuing downward trend has occurred in adult smoking since 1977, when rates for men and women were 41.1% and 30%, respectively.4 In the 2014 NSW population health survey, 18.9% of adult men and 12.3% of women were current smokers.5
The decline in smoking prevalence observed in Australia over the past 30 years has been the result of the implementation of key tobacco control activities, including bans on tobacco promotion, increases in the price of cigarettes, anti-tobacco mass media campaigns, health warnings on tobacco products and smoking restrictions.3 Despite the decline, the burden of tobacco-caused death and disease from cancer, chronic obstructive pulmonary disease, ischaemic heart disease and other causes remains high in Australia.
In Australia in 2005, an estimated 11 308 new cases of cancer were attributed to smoking and 8155 deaths from cancer were attributed to smoking, representing 11% of all cancers and 21% of cancer deaths.6 Tobacco smoking was estimated to be responsible for more than 75% of lung cancers; around 50% of oral and oesophageal cancers; and around 20% or more of bladder, kidney and pancreatic cancers. In the US, approximately 40% of the decrease in the overall male cancer death rate between 1991 and 2003 was estimated to be a result of reductions in tobacco smoking.7 This estimate included only lung cancer. Tobacco control can reduce the population-level impact not only of lung cancer, but also of a range of smoking-related cancers.
In this study, we estimated the population-attributable fraction (PAF) of cancers due to smoking. Current and historical smoking prevalence data are poor indicators of accumulated population exposure to smoking because exposure depends on the age of smoking initiation, duration of smoking, the number and type of cigarettes smoked and smoking behaviour (e.g. degree of inhalation).8 We therefore used an indirect method – the smoking impact ratio (SIR)9 – to estimate the accumulated impact of smoking in NSW. We assessed the impact that smoking-attributable cancer mortality has had on trends in cancer mortality in NSW between 1972 and 2008. Data on the number of cancer deaths caused by smoking in NSW are lacking. This study will provide data to inform cancer prevention and health policy in NSW.
Methods
Cancer death data
Cancer death data (excluding nonmelanoma skin cancer) were obtained from the NSW Central Cancer Registry (CCR) for the years 1972 to 2008 (the most recent cancer mortality data available from the CCR). The CCR is a population-based register of all cancer cases diagnosed in NSW residents, including cancer notifications from hospitals, health facilities and pathology laboratories. Notification of cancer has been mandatory since 1971, with the CCR now operating under the Public Health Act 2010 (NSW). Cause of cancer death is assigned in the CCR using information from the Australian Bureau of Statistics (ABS) and cancer notifications.10 Underlying cause of death is coded according to the International Statistical Classification of Diseases and Related Health Problems, Tenth Revision, Australian Modification (ICD-10-AM) by the ABS from death certificates provided by the Registrar of Births, Deaths and Marriages in each state and territory.
Estimation of smoking-attributable cancer deaths
The number of smoking-attributable cancer deaths in NSW was estimated using the SIR method.8, 9,11 The SIR is an indirect estimate of the accumulated exposure to tobacco smoking in a population derived from lung cancer mortality. It is calculated as the ratio of the lung cancer (CLC) in excess of never-smokers (NLC) in the study population relative to the excess lung cancer mortality in a reference group of smokers (S*LC) and never-smokers (L*LC):
SIR = (CLC − NLC)/(S*LC − N*LC)
The American Cancer Society’s Cancer Prevention Study II (CPS-II) was used as the reference population.9,11 Never-smokers in NSW were assumed to have the same lung cancer mortality rates as those in the CPS-II, since no NSW data are available (see CPS-II tables and data in Thun et al.12). Lung cancer mortality rates in never-smokers from the CPS-II were smoothed using Poisson regression, because the small number of deaths, particularly in the younger age groups, led to unstable estimates. The SIR was calculated for men and women in 5-year age groups from 35 to 80+ years for each year between 1972 and 2008. SIRs greater than 1 were set to 1 – this occurs when the study population has higher lung cancer mortality than the CPS-II smokers, which reflects that lung cancer mortality is affected by age at smoking initiation, and the type and number of cigarettes smoked.8 No deaths were attributed to smoking when the age-specific lung cancer mortality rate in NSW was less than the CPS-II never-smoker rate.
The SIR converts the exposure to smoking in the NSW population to an equivalent prevalence of smokers in the CPS-II for whom the risk of cancer mortality has been measured.9,11 The annual age- and sex-specific SIR is used as the proxy of prevalence (Pe) in the standard formula for the PAF:
PAF = Pe(RR – 1)/(Pe(RR – 1) + 1)
The PAF of cancer mortality from smoking was estimated for cancer sites with relative risks (RRs) reported from the CPS-II. These sites are cancer of the lung, upper aerodigestive tract, stomach, pancreas, liver, bowel, bladder, cervix, kidney and other urinary organs, and myeloid leukaemia. The RRs for each cancer site were the multivariate risk-adjusted values from the CPS-II for lifelong current smokers compared with never-smokers (see CPS-II tables and data in Ezzati et al.11). Most of the RRs were estimated using 6 years of follow-up, reducing the potential for misclassification of smoking status due to quitting smoking, while accumulating enough deaths among never-smokers for stable estimates.13 The RRs for stomach and colorectal cancer were estimated using 14 years of follow-up, which may lead to an underestimation of the RR due to smoking cessation following ascertainment of smoking status at baseline.11 Smoking-attributable cancer deaths were estimated by multiplying the annual age- and sex-specific PAF for each site by the corresponding annual number of cancer deaths in NSW. Undiscounted years of life lost to age 75 were calculated for smoking-attributable cancer deaths.
Analysis of cancer mortality rates
Directly age-standardised cancer mortality rates were calculated using the 2001 Australian Standard Population and mid-year NSW population estimates.14 Similar to other estimates6, age-standardised rates per head of population were calculated to quantify the population-level impact of smoking, removing the effect of the changing age structure of the NSW population over the study period. Trends in age-standardised cancer mortality rates were analysed using the Joinpoint regression program (Version 3.4.2, April 2010, Statistical Research and Applications Branch, National Cancer Institute) to identify the turning point in the overall cancer mortality trend. Once the peak year of the all-cancer mortality rate was identified, trends in mortality from smoking-related cancer sites were analysed. Trends between the peak year and 2008 were summarised using the average annual percentage change (AAPC) from the Joinpoint program. The AAPC provides a summary measure of the trend over a specific time period, using the annual percentage change of segments from the Joinpoint model.15
Results
Trends in cancer mortality in NSW
By 2008, the age-standardised all-cancer mortality rate in NSW males decreased by 26% from the peak in 1989 (Figure 1, Table 1). Smoking-attributable cancer mortality peaked earlier among men, in 1984, and from 1989 decreased on average by 2.3% per year (95% CI 1.8%, 2.7%). Pancreatic cancer mortality was stable, and oesophageal and liver cancer mortality increased significantly between 1989 and 2008. The decrease in the smoking-attributable cancer mortality rate between 1989 and 2008 accounted for 44% of the decrease in the cancer mortality rate for males overall. The percentage of cancer deaths attributable to smoking has been decreasing since the 1980s. Nevertheless, in 2008, 29% of cancer deaths in men could still be attributed to smoking. Lung cancer remained the largest cause of cancer death in 2008, making up 22.5% of all male cancer deaths. There were around 80% more lung cancer deaths (n = 1666) than bowel (n = 935) cancer deaths in 2008.
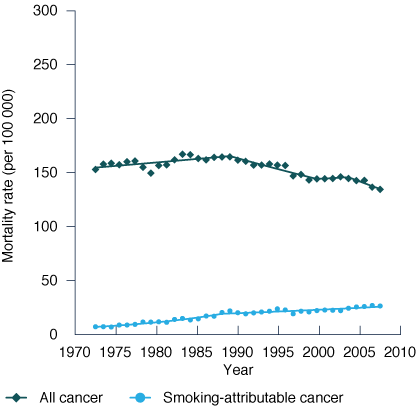
Female age-standardised all-cancer mortality peaked in 1989 and has since decreased by 19% (Figure 1, Table 1). The smoking-attributable cancer mortality rate increased by 7% (95% CI 6.0%, 8.1%) per year from 1972 until the late 1980s, then slowed to a 1.5% (95% CI 1.0%, 2.0%) increase annually. A decrease in breast cancer mortality accounted for 32% of the decrease in the cancer mortality rate overall and was the site with the largest contribution to the reduction in all-cancer mortality. There was a significant increase in mortality from lung cancer (1.3% per year, 95% CI 1.0%, 1.7%), pancreatic cancer (0.4% per year, 95% CI 0.1%, 0.7%) and liver cancer (6.1% per year, 95% CI 5.4%, 6.9%) between 1989 and 2008. By 2008, lung cancer was the largest cause of cancer death in women, with 10% more lung cancer deaths (n = 998) than breast cancer deaths (n = 904). The percentage of cancer deaths attributable to smoking increased continually from around 5% in the mid-1970s to one in five cancer deaths (20%) in females in 2008. In 2008, the number of smoking-attributable cancer deaths among women was half the number among men, with the age-standardised rate being 55% lower in women (26.8 deaths per 100 000) compared with men (61.0 deaths per 100 000).
Figure 1. Annual age-standardised cancer mortality rates from all cancers and smoking-attributable cancer,
(a) males and (b) females, NSW, 1972–2008
(a) Males (b) Females
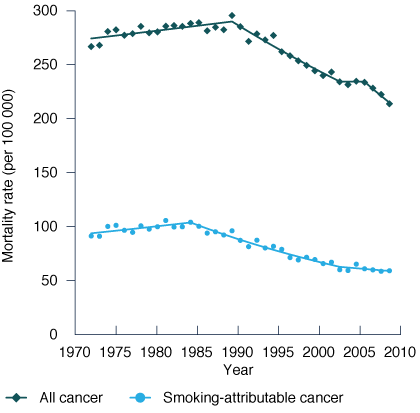
Note (a) Males: Annual percentage changes in age-standardised mortality rates from Join point regression models are as follows: All cancer: 1972–1989: 0.3% (95% CI 0.1%, 0.5%); 1989–2002: –1.6% (95% CI –1.8%, –1.4%); 2002–2005 0.0% (95% CI –2.9%, +2.9%); 2005–2008: –2.8% (95% CI –4.1%, –1.5%)
Smoking-attributable cancer: 1972–1984: 0.9% (95% CI 0.0%, 1.8%); 1984–2002: –2.8% (95% CI –3.1%, –2.5%); 2002–2008: -1.1% (95% CI –2.2%, 0.1%)
Note (b) Females: Annual percentage changes in age-standardised mortality rates from Join point regression models are as follows: All cancer: 1972–1989: 0.4% (95% CI 0.1%, 0.6%); 1989–2000: –1.2% (95% CI –1.6%, –0.9%); 2000–2004: 0.3% (95% CI –1.8%, 2.5%); 2004–2008: –1.9% (95% CI –3.2%, –0.7%)
Smoking-attributable cancer: 1972–1988: 7.0% (95% CI 6.0%, 8.1%); 1988–2008: 1.5% (95% CI 1.0%, 2.0%).
Smoking-attributable cancer deaths by age and cancer type
The annual number of smoking-attributable cancer deaths among men has remained relatively constant at around 2000 each year since the 1980s (Figure 2), despite population growth and ageing during this time. The number of smoking-attributable cancer deaths in 35−54 and 55−74-year-old men decreased by 17% and 35%, respectively, between 1989 and 2008 (Table 2).
Table 1. Trends in age-standardised mortality rates of smoking-related cancer sites, NSW, 1989–2008
| Sex | Cancer type (ICD-10-AM code) | No. (% of all cancer deaths) | Modelled age-standardised mortality rate per 100 000 (raw) | % change 1989–2008 | AAPC 1989–2008 (95% CI) |
Change in rate (per 100 000) | % of all cancer rate changea | ||
| 1989 | 2008 | 1989 | 2008 | ||||||
| Male | All cancer | 6340 | 7391 | 288.6 (294.2) | 213.9 (212.9) | –26 | –1.6 (–2.1, –1.1) |
–74.7 | (100) |
| Lung (C33-4) | 1649 (26.0) | 1666 (22.5) | 68.5 (72.1) |
47.1 (47.5) | –31 | –1.9 (–2.3, –1.6) | –21.4 | 29 | |
| Bowel (C18-21) | 837 (13.2) | 935 (12.7) | 37.8 (39.9) |
27 (26.9) |
–29 | –1.8 (–2.0, –1.5) | –10.8 | 14 | |
| Stomach (C16) | 305 (4.8) | 297 (4.0) | 14.4 (14.3) |
8.1 (8.5) |
–44 | –3.0 (–3.2, –2.8) | –6.3 | 8 | |
| Head and neck (C01-14, C30-32) | 284 (4.5) | 257 (3.5) | 11.4 (11.7) |
7.3 (7.2) |
–36 | –2.3 (–2.7, –1.9) | –4.1 | 5 | |
| Pancreas (C25) | 261 (4.1) | 381 (5.2) | 10.7 (12.4) |
11.4 (10.8) | 6 | 0.3 (–0.4, 1.0) (NS) | 0.7 | – | |
| Leukaemia (C91-5)b | 238 (3.8) | 259 (3.5) | 10 (11.2) |
7.7 (7.6) |
–23 | –1.3 (–1.9, –0.8) | –2.3 | 3 | |
| Bladder (C67) | 180 (2.8) | 207 (2.8) | 9.2 (9.4) |
6.7 (6.2) |
–28 | –1.7 (–2.0, –1.4) | –2.6 | 3 | |
| Kidney and other urinary (C64-6, C68) | 140 (2.2) | 186 (2.5) | 6.3 (6.1) |
5.8 (5.3) |
–9 | –0.5 (–0.9, –0.1) | –0.5 | 1 | |
| Oesophagus (C15) | 137 (2.2) | 221 (3.0) | 5.4 (6.0) |
6.3 (6.2) |
17 | 0.8 (0.4, 1.3) | 0.9 | – | |
| Liver (C22) | 69 (1.1) | 220 (3.0) | 2.8 (2.7) |
6.6 (6.2) |
132 | 4.5 (3.5, 5.5) | 3.8 | – | |
| Smoking attributable | 2277 (36) | 2144 (29) | 94.1 (100.4) |
61.0 (61.2) | –35 | –2.3 (–2.7, –1.8) | –33.1 | 44 | |
| Female | All cancer | 4677 | 5822 | 165.1 (164.4) | 134.5 (134.1) | –19 | –1.1 (–1.6, –0.5) |
–30.7 | (100) |
| Breast (C50)c | 899 (19.2) | 904 (15.5) | 31.4 (32.3) |
21.6 (21.6) | –31 | –2.0 (–3.0, –0.9) | –9.9 | 32 | |
| Bowel (C18-21) | 678 (14.5) | 781 (13.4) | 23.9 (23.6) |
17.4 (17.7) | –27 | –1.7 (–1.8, –1.5) | –6.5 | 21 | |
| Lung (C33-4) | 564 (12.1) | 998 (17.1) | 18.3 (19.6) |
23.4 (23.8) | 28 | 1.3 (1.0, 1.7) | 5.1 | – | |
| Pancreas (C25) | 241 (5.2) | 368 (6.3) | 7.6 (8.2) |
8.2 (8.2) |
9 | 0.4 (0.1, 0.7) | 0.7 | – | |
| Ovary (C56-57.7)c | 219 (4.7) | 285 (4.9) | 7.5 (7.7) |
6.6 (6.8) |
–12 | –0.7 (–0.9, –0.4) | –0.9 | 3 | |
| Stomach (C16) | 158 (3.4) | 183 (3.1) | 6.1 (5.6) |
3.8 (4.1) |
–37 | –2.4 (–3.2, –1.6) | –2.3 | 7 | |
| Leukaemia (C91-5)b | 144 (3.1) | 162 (2.8) | 5.7 (5.0) |
3.8 (3.7) |
–33 | –2.1 (–2.9, –1.3) | –1.9 | 6 | |
| Cervix (C53) | 140 (3.0) | 101 (1.7) | 4.4 (5.0) |
2.2 (2.5) |
–51 | –3.6 (–5.2, –2.0) | –2.2 | 7 | |
| Kidney and other urinary (C64-6, C68) | 114 (2.4) | 116 (2.0) | 3.9 (3.9) |
2.8 (2.7) |
–27 | –1.7 (–2.3, –1.0) | –1.1 | 3 | |
| Oesophagus (C15) | 88 (1.9) | 118 (2.0) | 2.7 (3.0) |
2.4 (2.5) |
–12 | –0.7 (–1.2, –0.2) | –0.3 | 1 | |
| Bladder (C67) | 87 (1.9) | 91 (1.6) |
2.6 (3.0) |
2.2 (1.9) |
–17 | –1.0 (–1.5, –0.5) | –0.4 | 1 | |
| Head and neck (C01-14, C30-32) | 83 (1.8) | 92 (1.6) |
2.9 (2.9) |
2.1 (2.1) |
–28 | –1.7 (–2.4, –1.0) | –0.8 | 3 | |
| Liver (C22) | 17 (0.4) | 91 (1.6) |
0.8 (0.6) |
2.5 (2.1) |
209 | 6.1 (5.4, 6.9) | 1.7 | – | |
| Smoking attributable | 662 (14) | 1186 (20) | 20.3 (22.9) |
26.8 (27.6) | 32 | 1.5 (1.0, 2.0) | 6.5 | –21 | |
AAPC = average annual percentage change; ICD-10-AM = International Statistical Classification of Diseases and Related Health Problems, Tenth Revision, Australian Modification; NS = not significantly different to zero
a Change in rate as a percentage of the change in the ‘All cancer’ mortality rate. The sum of percentages is greater than 100 because the mortality rate for some cancer sites increased.
b Only myeloid leukaemia was included in the calculation of smoking-attributable cancer mortality.
c Although there is now limited evidence that smoking plays a role in the aetiology of breast and mucinous ovarian cancer, there is no estimate of risk from the American Cancer Society’s Cancer Prevention Study II (CPS-II) and therefore smoking-attributable mortality was not estimated.
Note: The AAPC is significantly different to zero (p < 0.05) in all cases except for pancreas cancer in males.
This decrease in the younger age groups led to a decrease in the annual number of years of life lost to age 75 years from smoking-attributable cancers from around 18 000 in the early 1980s to 11 900 in 2008 (Figure 2). The number of smoking-attributable cancer deaths in men 75 years and older increased by 63% between 1989 (n = 645) and 2008 (n = 1052).
Smoking-attributable cancer mortality in women has increased steadily since the 1970s, when there were around 150 smoking-attributable cancer deaths each year (Figure 2). In 2008, there were 1186 female smoking-attributable cancer deaths. The years of life lost to age 75 years from smoking-attributable cancer mortality increased from 2100 in 1972 to 6100 in 2008. The number of smoking-attributable cancer deaths increased by 52% and 14% between 1989 and 2008 (Table 2) in women aged 35−54 and 55−74 years, respectively. The greatest increase in the annual number of smoking-attributable cancer deaths was in women over 75 years of age with a more than threefold increase between 1989 (n = 189) and 2008 (n = 624). This reflects an increase in the smoking-attributable cancer mortality rate in women aged 75 years or older, and also an increasing population of older women in NSW over this period.
For men in 2008, 84% of lung (n = 1400) and 64% of upper aerodigestive (n = 300) cancer deaths were attributable to smoking (Table 2). Approximately 25% or more of stomach, liver, pancreas, bladder and kidney male cancer deaths were attributable to smoking. For women in 2008, 774 (78%) lung and 122 (60%) upper aerodigestive cancer deaths were attributable to smoking. Approximately 25% of pancreas and bladder cancer deaths, and a smaller proportion of kidney, stomach, liver and cervical cancer deaths were attributable to smoking. For both men and women, 65% of smoking-attributable cancer deaths were from lung cancer.
Discussion
Cancer mortality has been decreasing in NSW since the late 1980s, with a greater decrease in men (26%) than in women (19%). Nearly half (44%) of the decrease in the all-cancer mortality rate for men between 1989 and 2008 was estimated to be a result of the decline in smoking-attributable cancer mortality. Despite the decline, there were 80% more lung cancer deaths (n = 1666) than both bowel (n = 935) and prostate (n = 930) cancer deaths among men in 2008.10 Smoking-attributable cancer mortality in women has been increasing since the 1970s, with the increase slowing since the late 1980s.
Table 2. Number of smoking-attributable cancer deaths and attributable fraction by site, 1989 and 2008
| No. of smoking‑attributable deaths | Smoking attributable fraction (%) | ||||
| Sex | Site (ICD-10-AM code) | 1989 | 2008 | 1989 | 2008 |
| Male | Lung (C33-4) | 1482 | 1400 | 90 | 84 |
| Upper aerodigestive (C00-15, C32) | 309 | 300 | 75 | 64 | |
| Stomach (C16) | 104 | 72 | 34 | 24 | |
| Liver (C22) | 25 | 54 | 36 | 25 | |
| Pancreas (C25) | 88 | 91 | 34 | 24 | |
| Bowel (C18-21) | 97 | 70 | 12 | 7 | |
| Kidney and other urinary (C64-6, C68) | 55 | 52 | 39 | 28 | |
| Bladder (C67) | 83 | 76 | 46 | 37 | |
| Myeloid leukaemia (C92, C93.0, C94.0, C94.2, C94.4-5) | 35 | 29 | 25 | 19 | |
| Total | 2277 | 2144 | 36 | 29 | |
| Female | Lung (C33-4) | 405 | 774 | 72 | 78 |
| Upper aerodigestive (C00-15, C32) | 88 | 122 | 52 | 60 | |
| Stomach (C16) | 16 | 24 | 10 | 13 | |
| Liver (C22) | 2 | 12 | 9 | 13 | |
| Pancreas (C25) | 49 | 100 | 20 | 27 | |
| Bowel (C18-21) | 54 | 86 | 8 | 11 | |
| Kidney and other urinary (C64-6, C68) | 12 | 16 | 10 | 14 | |
| Bladder (C67) | 18 | 28 | 21 | 31 | |
| Cervix (C53) | 14 | 12 | 10 | 12 | |
| Myeloid leukaemia (C92, C93.0, C94.0, C94.2, C94.4-5) | 5 | 9 | 6 | 8 | |
| Total | 662 | 1186 | 14 | 20 | |
ICD-10-AM = International Statistical Classification of Diseases and Related Health Problems, Tenth Revision, Australian Modification
Note: Cancer groups with relative risks are reported from the American Cancer Society’s Cancer Prevention Study II (CPS-II); discrepancies in totals are due to rounding to the nearest whole number.
Table 3. Number of smoking-attributable cancer deaths and attributable fraction by age, 1989 and 2008
| No. of smoking‑attributable deaths | Smoking attributable fraction (%) | ||||
| Sex | Age | 1989 | 2008 | 1989 | 2008 |
| Male | 35–54 years | 183 | 151 | 30 | 26 |
| 55–74 years | 1449 | 941 | 42 | 32 | |
| 75+ years | 645 | 1052 | 30 | 28 | |
| Total | 2277 | 2144 | 36 | 29 | |
| Female | 35–54 years | 66 | 100 | 10 | 17 |
| 55–74 years | 407 | 462 | 18 | 22 | |
| 75+ years | 189 | 624 | 11 | 20 | |
| Total | 662 | 1186 | 14 | 20 | |
Figure 2. Smoking-attributable cancer deaths by age group and years of life lost to age 75, (a) males and
(b) females, NSW, 1972–2008
(a) Males (b) Females
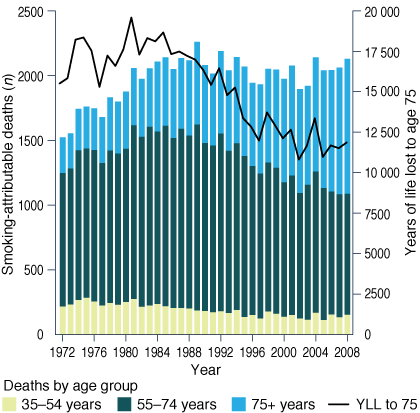
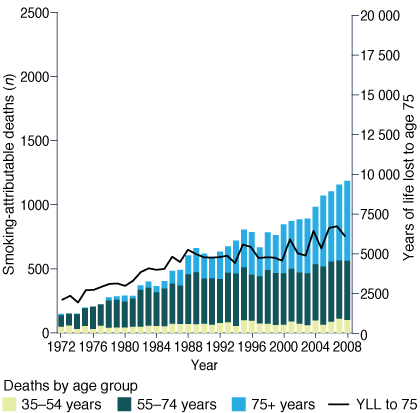
YLL to 75 = years of life lost to age 75
The most recent figures published on smoking-attributable cancer mortality in NSW are from the Australian Institute of Health and Welfare (AIHW), which reports an average annual 1878 male and 770 female cancer deaths from 1999 to 2003 (derived using the SIR method).16 Estimates from the current study are slightly higher, with 1997 male and 851 female smoking-attributable cancer deaths per year for the same period. The current study includes estimates of smoking-attributable colon, rectal, liver and cervical cancer deaths, which were not included as smoking-related cancers by the AIHW. The smoking-attributable fraction of lung cancer for men from the current study for 2008 is the same as the national figure reported by the AIHW for 2005 (84%), with the estimate for women being very similar (current study: 78%; AIHW: 77%).6 For other sites, the smoking-attributable fraction was higher (e.g. male stomach cancer, current study: 24%; AIHW: 14%) or lower (e.g. male bladder cancer, current study: 37%; AIHW: 43%).
The SIR method enables smoking-attributable cancer mortality to be estimated in the absence of detailed smoking history data. Furthermore, current and ex-smoker prevalence data alone are insufficient to estimate smoking-attributable cancer mortality because the risk of cancer depends on the duration and intensity of smoking for current smokers, and for ex-smokers on the duration and age at quitting.17 The SIR converts the smoking history of a study population to an equivalent prevalence of smokers in a reference population. The CPS-II is commonly used as the reference population because lung cancer mortality rates by smoking status and the RR of mortality for smokers have been estimated for a range of cancer sites, and the large sample size (nearly 1.2 million people) provides relatively stable estimates.2, 11
The assumption in this study that never-smokers in NSW have the same lung cancer mortality as those in the CPS-II was necessary in the absence of NSW and Australian data. However, we expect never-smokers in NSW to have similar occupational and environmental exposures to lung cancer risk factors at a population level as the 0.48 million never-smokers in the CPS-II. Lung cancer mortality among CPS-II never-smokers is similar to other cohort studies that show lung cancer mortality among never-smokers appears to be stable over time.18 Nevertheless, the applicability of lung cancer mortality rates in never-smokers is a source of uncertainty in this study. Additional uncertainty is introduced from the estimates of lung cancer mortality rates from the CPS-II, particularly for the younger (35−45 years) and older (80+ years) age groups, which are less stable due to smaller numbers of deaths.
Use of multivariate risk-adjusted RRs has improved the SIR method compared with the original implementation by Peto et al.9 because smokers had different sociodemographic characteristics compared with never-smokers in the CPS-II. However, there may be residual confounding of the RRs that may lead to an overestimation of smoking-attributable cancer mortality if smoking is associated with other cancer risk factors (e.g. alcohol and diet) that have not been fully adjusted for. Differences in exposures to other cancer risk factors and underlying patterns of disease in NSW may mean that the risk of cancer mortality from smoking may not be the same as the RRs from the CPS-II. However, the RR of all-cause mortality for current smokers in NSW in the 45 and Up Study is similar to estimates from cohorts in the UK and the US.19 Estimates of the risk of smoking and other factors derived from cohorts that are not representative have been found to be generalisable.19, 20 Directly estimating the excess cancer mortality in Australia’s 45 and Up Study of ageing would provide the best estimate of the current burden of smoking-attributable cancer mortality in NSW, but indirect methods are required to estimate the past impact of smoking on cancer mortality. Estimates of smoking-attributable mortality using the SIR method have shown good concordance with estimates using alternative methods for high-income countries outside the US.21
This study included cancer sites in the estimates of smoking-attributable cancer mortality for which there is a well-established evidence base for the aetiological role of smoking. Estimates of smoking-attributable breast cancer mortality were not included, although there is suggestive evidence that smoking increases the risk of breast cancer by 10−20% and shows a dose–response relationship with duration of smoking and number of cigarettes smoked.22 Smoking-attributable cancer mortality from second-hand tobacco smoke was not included, but it increases the risk of lung cancer and other cancers in never-smokers.22 There is evidence that smoking plays a role in the aetiology of mucinous ovarian cancers; however, this is balanced by a decreased risk of clear-cell ovarian and endometrial cancers.23
Smoking can increase mortality from cancers for which there is limited evidence that smoking plays a role in the aetiology, such as prostate and breast cancer. Smokers diagnosed with prostate cancer have poorer survival from the cancer, independent of prognostic factors such as Gleason score, stage at diagnosis and primary treatment.22 Women who were smokers at the time of diagnosis of breast cancer are more likely to develop systemic recurrence after surgery.24 Moreover, smoking can decrease the effectiveness of many treatments for cancers, and smokers diagnosed with cancer should be encouraged and supported in attempts to quit through the provision of cessation services.25
Patterns of disease are a good indicator of smoking prevalence in previous decades, particularly for smoking-attributable cancers that can take decades to develop. Since the majority of lung cancers are attributable to smoking, changes in smoking prevalence are the key driver of lung cancer mortality trends. Survival from lung cancer remains poor, with 16% of people diagnosed between 2002 and 2006 surviving 5 years10, which is only slightly higher than the 5-year survival of 12% of people diagnosed between 1989 and 1993.26 For sites with a lower smoking-attributable fraction, factors other than smoking have contributed to trends in mortality. For stomach cancer, the decrease in mortality by around 3% per year since 1989 in both men and women reflects a decrease in underlying stomach cancer incidence. Similar substantial decreases in stomach cancer incidence and mortality have occurred in many countries around the world, possibly due to lower infection rates of Helicobacter pylori and changes to diet.27 For cervical cancer, the introduction of an organised screening program in Australia in 1991 led to significant reductions in cervical cancer incidence and mortality.28 In NSW, cervical cancer mortality decreased by 51% between 1989 and 2008. Although all cervical cancer may be considered as attributable to human papillomavirus (HPV) infection, smoking increases the risk of squamous cell cervical cancer in women infected with oncogenic HPV.29
Tobacco control efforts implemented in Australia and NSW since the early 1960s have led to declines in smoking prevalence, and this study provides estimates of the impact this has had on cancer mortality in NSW. Just under one-third (29%) of male cancer deaths were attributable to smoking in 2008, indicating that the impact of high smoking prevalence (40%) in the 1970s4 is still affecting men in NSW. Although smoking-attributable cancer mortality continues to increase among women, it is still around half the rate of males and will not reach the level experienced by men, because men had a higher peak smoking prevalence and continue to have higher prevalence.4, 5 Nevertheless, lung cancer has now overtaken breast cancer as the largest cause of cancer death among women in NSW. The introduction of a population mammography screening program in NSW, and advances in diagnosis and treatment, have decreased mortality from breast cancer.30 Lung cancer mortality in women is expected to peak 25−40 years after peak tobacco consumption.31 With smoking prevalence among women peaking in the mid to late 1970s3,4, lung cancer and smoking-attributable cancer mortality should peak in the next 5 years.
Conclusion
Around 3330 cancer deaths in NSW each year are due to current and past smoking. More than one in four male cancer deaths (29%) and one in five female cancer deaths (20%) could be attributed to smoking in 2008. Substantial reductions in cancer mortality in NSW can be achieved by reducing the prevalence of smoking. Quitting smoking, even in middle age, significantly reduces cancer mortality.17 People who stop smoking at 50 years of age have a 6% cumulative risk of lung cancer death up to age 75, compared with 16% for continuing smokers.17 Tobacco control efforts must continue to be emphasised as part of a comprehensive cancer control plan. They are important sources of motivation and support for smokers to quit, prevent the uptake of smoking, and will continue to make a significant contribution to reducing cancer mortality.
Acknowledgements
The authors would like to acknowledge Wai Tak Hung for his earlier work on lung cancer mortality trends.
Copyright:

© 2015 Creighton et al. This work is licensed under a Creative Commons Attribution-NonCommercial-ShareAlike 4.0 International Licence, which allows others to redistribute, adapt and share this work non-commercially provided they attribute the work and any adapted version of it is distributed under the same Creative Commons licence terms.
References
- 1. Australian Institute of Health and Welfare. Australian burden of disease study: fatal burden of disease 2010. Canberra: AIHW; 2015 [cited 2015 May 5]. Available from: www.aihw.gov.au/publication-detail/?id=60129550176
- 2. Begg S, Vos T, Barker B, Stevenson C, Stanley L, Lopez A. The burden of disease and injury in Australia 2003. Canberra: Australian Institute of Health and Welfare; 2007 [cited 2015 May 5]. Available from: www.aihw.gov.au/publication-detail/?id=6442467990
- 3. Scollo M, Winstanley MH. Tobacco in Australia: facts and issues. 4th ed. Melbourne: Cancer Council Victoria; 2012 [cited 2015 May 7]. Available from: www.tobaccoinaustralia.org.au
- 4. Centre for Epidemiology and Research. The health of the people of New South Wales: report of the Chief Health Officer. Sydney: NSW Department of Health; 2010.
- 5. Health statistics New South Wales: current smoking by age and sex, NSW 2014. Sydney: NSW Ministry of Health; [cited 2015 Jun 22]. Available from: www.healthstats.nsw.gov.au/Indicator/beh_smo_age/beh_smo_age_snap?&topic=Smoking&topic1=topic_smo&code=beh_smo
- 6. Australian Institute of Health and Welfare, Australasian Association of Cancer Registries. Cancer in Australia: an overview, 2008. Canberra: AIHW; 2008 [cited 2015 May 5]. Available from: www.aihw.gov.au/publication-detail/?id=6442468196
- 7. Thun MJ, Jemal A. How much of the decrease in cancer death rates in the United States is attributable to reductions in tobacco smoking? Tob Control. 2006;15(5):345−7. CrossRef | PubMed
- 8. Ezzati M, Lopez A. Smoking and oral tobacco use. In: Ezzati M, Lopez A, Rodgers A, Murray C, editors. Comparative quantification of health risks: global and regional burden of diseases attributable to selected major risk factors. Geneva: World Health Organization; 2004 [cited 2015 May 5]. Available from: www.who.int/healthinfo/global_burden_disease/cra/en/
- 9. Peto R, Lopez AD, Boreham J, Thun M, Heath C. Mortality from tobacco in developed countries: indirect estimation from national vital statistics. Lancet. 1992;339(8804):1268−78. CrossRef
- 10. Tracey E, Kerr T, Dobrovic A, Currow D. Cancer in NSW: incidence and mortality report 2008. Sydney: Cancer Institute NSW; 2010 [cited 2015 May 5]. Available from: www.cancerinstitute.org.au/publications/cancer-in-nsw-incidence-and-mortality-2008
- 11. Ezzati M, Henley SJ, Lopez AD, Thun MJ. Role of smoking in global and regional cancer epidemiology: Current patterns and data needs. Int J Cancer. 2005;116(6):963−71. CrossRef | PubMed
- 12. Thun MJ, Myers DG, Day-Lally C, Namboodiri MM, Calle EE, Flanders WD, et al. Chapter 5: Age and the exposure-response relationships between cigarette smoking and premature death in Cancer Prevention Study II. In: Shopland D, Burns D, Garfinkel L, Samet J, editors. Monograph 8: Changes in cigarette-related disease risks and their implications for prevention and control. Bethesda: National Cancer Institute; 1997 [cited 2015 May 20]. Available from: cancercontrol.cancer.gov/Brp/tcrb/monographs/8/m8_complete.pdf
- 13. Thun MJ, Apicella LFM, Henley SJM. Smoking vs other risk factors as the cause of smoking-attributable deaths: confounding in the courtroom. JAMA. 2000;284(6):706−12. CrossRef | PubMed
- 14. Australian Bureau of Statistics. Population by age and sex, Australian states and territories, 2009 Jun. Canberra: Australian Bureau of Statistics; 2009 [cited 2015 May 5].
- 15. Clegg LX, Hankey BF, Tiwari R, Feuer EJ, Edwards BK. Estimating average annual per cent change in trend analysis. Stat Med. 2009;28(29):3670−82. CrossRef | PubMed
- 16. Australian Institute of Health and Welfare, Australasian Association of Cancer Registries. Cancer in Australia: an overview, 2006. Canberra: AIHW; 2007 [cited 2015 May 5]. Available from: www.aihw.gov.au/publication-detail/?id=6442468003
- 17. Peto R, Darby S, Deo H, Silcocks P, Whitley E, Doll R. Smoking, smoking cessation, and lung cancer in the UK since 1950: combination of national statistics with two case-control studies. BMJ. 2000;321(7257):323−9. CrossRef | PubMed
- 18. Thun MJ, Hannan LM, Adams-Campbell LL, Boffetta P, Buring JE, Feskanich D, et al. Lung cancer occurrence in never-smokers: an analysis of 13 cohorts and 22 cancer registry studies. PLoS Med. 2008;5(9):e185. CrossRef | PubMed
- 19. Banks E, Joshy G, Weber MF, Liu B, Grenfell R, Egger S, et al. Tobacco smoking and all-cause mortality in a large Australian cohort study: Findings from a mature epidemic with current low smoking prevalence. BMC Med. 2015;13:38. CrossRef | PubMed
- 20. Mealing N, Banks E, Jorm L, Steel D, Clements M, Rogers K. Investigation of relative risk estimates from studies of the same population with contrasting response rates and designs. BMC Med Res Methodol. 2010;10(1):26. CrossRef | PubMed
- 21. Preston SH, Glei DA, Wilmoth JR. A new method for estimating smoking-attributable mortality in high-income countries. Int J Epidemiol. 2010;39(2):430−8. CrossRef | PubMed
- 22. US Public Health Service, Office of the Surgeon General. Chapter 6. Cancer. The health consequences of smoking − 50 years of progress: a report of the Surgeon General, 2014. Atlanta: US Department of Health and Human Services, Centers for Disease Control and Prevention, National Center for Chronic Disease Prevention and Health Promotion, Office on Smoking and Health; 2014 [cited 2015 Mar]. Available from: www.surgeongeneral.gov/library/reports/50-years-of-progress/sgr50-chap-6.pdf
- 23. Collaborative Group on Epidemiological Studies of Ovarian Cancer, Beral V, Gaitskell K, Hermon C, Moser K, Reeves G, et al. Ovarian cancer and smoking: individual participant meta-analysis including 28,114 women with ovarian cancer from 51 epidemiological studies. Lancet Oncol. 2012;13(9):946−56. CrossRef
- 24. Murthy BL, Thomson CS, Dodwell D, Shenoy H, Mikeljevic JS, Forman D, et al. Postoperative wound complications and systemic recurrence in breast cancer. Br J Cancer. 2007;97(9):1211−7. CrossRef | PubMed
- 25. Mazza R, Lina M, Boffi R, Invernizzi G, De Marco C, Pierotti M. Taking care of smoker cancer patients: a review and some recommendations. Ann of Oncol. 2010;21(7):1404−9. CrossRef | PubMed
- 26. Tracey E, Barraclough H, Chen W, Baker D, Roder D, Jelfs P, et al. Survival from cancer in NSW: 1980−2003. Sydney: Cancer Institute NSW; 2007 [cited 2015 Jun 10]. Available from: www.cancerinstitute.org.au/media/28959/2007-10_survival_from_cancer_in_nsw_1980-2003.pdf
- 27. Bertuccio P, Chatenoud L, Levi F, Praud D, Ferlay J, Negri E, et al. Recent patterns in gastric cancer: a global overview. Int J Cancer. 2009;125(3):666−73. CrossRef | PubMed
- 28. Taylor R, Morrell S, Hassan M, Wain G, Ross J. Decline in cervical cancer incidence and mortality in New South Wales in relation to control activities (Australia). Cancer Causes Control. 2006;17(3):299−306. CrossRef | PubMed
- 29. Kapeu AS, Luostarinen T, Jellum E, Dillner J, Hakama M, Koskela P, et al. Is smoking an independent risk factor for invasive cervical cancer? A nested case-control study within Nordic biobanks. Am J Epidemiol. 2009;169(4):480−8. CrossRef | PubMed
- 30. Taylor R, Morrell S, Estoesta J, Brassil A. Mammography screening and breast cancer mortality in New South Wales, Australia. Cancer Causes Control. 2004;15(6):543−50. CrossRef | PubMed
- 31. Adair T, Hoy D, Dettrick Z, Lopez AD. Reconstruction of long-term tobacco consumption trends in Australia and their relationship to lung cancer mortality. Cancer Causes Control. 2011;22(7):1047−53. CrossRef | PubMed