Abstract
Objectives: Many large-scale developments in Australia, such as road infrastructure, are subject to community concern due to their ongoing emission of particulate matter that may lead to adverse health impacts. The assessment of these impacts is guided by planning and health policies, but these policies have limitations. The objective of this paper is to provide an approach to setting an incremental guideline that can be used by regulators and health professionals to assess the impact of particulate matter from a development on a population, specifically the impact of particulate matter less than or equal to 2.5 micrometres in diameter (PM2.5).
Type of program or service: Environmental health policy.
Methods: The calculation of PM2.5 concentrations and life days lost using concentration response functions and life tables.
Results: We calculated annual incremental concentrations of PM2.5 for a 1 in 1 000 000 increased risk of mortality, a 1 in 100 000 increased risk of mortality and a 1 in 10 000 increased risk of mortality along with associated life days lost. These values can be used to assess the acceptability of PM2.5 health impacts from a development.
Lessons learnt: An incremental annual PM2.5 concentration of up to 0.02µg/m3 could be considered negligible, while concentrations between 0.02 and 1.7 µg/m3 could be considered acceptable/tolerable, with concentrations greater than 1.7 µg/m3 considered unacceptable.
Full text
Introduction
Particulate matter, also known as particle pollution or PM, is a term that describes extremely small solid particles and liquid droplets suspended in air. Particulate matter can be made up of a variety of components and mainly comes from motor vehicles, wood-burning heaters, bushfires and industry.1
A component of many developments such as transport infrastructure involves the ongoing generation of particulate matter. This particulate matter will enter the atmosphere and may travel offsite to impact local communities.
Particle size is an important issue when considering potential health impacts of particulate matter. Larger particles, often referred to as dust, are generally trapped by the body’s natural defences in the nose and throat. Particles with a diameter of 10 micrometres or less (PM10) are small enough to pass through the throat and nose and enter the lungs, while particles with a diameter of 2.5 micrometres or less (PM2.5) and a diameter of 0.1 micrometres or less (PM0.1) can penetrate deeper into the lungs and into the bloodstream.1 Most current research has therefore focused on the impact of PM10 and PM2.5 particles, with emerging research into PM0.1.
Particulate matter has been associated with a number of adverse health outcomes both from short-term and long-term exposure, including mortality, cardiovascular effects and respiratory effects.2,3 However, in terms of strength of evidence, PM2.5 are the particles with the greatest evidence of health impact. In a review, the US Environmental Protection Agency (EPA) determined a causal relationship with exposure to PM2.5 and mortality as well as cardiovascular effects.2
Current Australian policies on PM2.5 impacts
In Australia, the National Environment Protection Council (NEPC) develops measures for particulate matter. Known as the National Environment Protection (Ambient Air Quality) Measure (NEPM), this measure sets a monitoring and reporting framework including ambient reporting standards which take the form of particulate matter concentration values.4 These measures are not intended to be used for a particular development but rather at an airshed level, that being the concentration of pollution in the airspace around a defined geographical area such as a city.
At an Australian state level, a number of policy documents have been developed, which look at the impact of particulate matter events such as bushfires on the community.5,6 Planning guidelines also exist that require proposed developments to conduct an assessment and compare predicted particulate matter impacts on local communities with NEPM values.7 However, we are unaware of an Australian government department that has issued formal guidance on the health assessment of the incremental particulate matter impacts of proposed developments, despite the requirement to assess such impacts as part of environmental planning processes.
Risk levels
No threshold has been identified regarding PM2.5 levels that are not associated with health impacts. Therefore, any exposure to PM2.5 is associated with a risk. The standard values of increased risk used within the Australian environmental health and planning professions range from 1 in 1 000 000 to 1 in 10 000. This review has considered impacts related to this range of risks.
Methods
Risk Estimate
To estimate the concentration of PM2.5 that would be associated with a set level of risk, a health endpoint, a concentration response function and the underlying incidence of the health endpoint is required.
Although exposure to PM2.5 has been associated with a number of health impacts, all-cause mortality risk has been chosen as the health endpoint to calculate an acceptable concentration of PM2.5. This use of all-cause mortality risk is supported by current guidance around mortality risk acceptability, the finality of this health endpoint, and its use by the US EPA and UK’s Committee on the Medical Effects of Air Pollutants2,8 as their primary endpoint in the calculation of health risk from PM2.5. Further, we have undertaken an analysis of development applications in Australia that have estimated the various health endpoints and their risk from incremental PM2.5 exposure. This private, unpublished analysis found all-cause mortality to be the most sensitive endpoint in terms of risk.
The concentration response function used in this paper is that recommended in a report published by the NEPC.9 It was derived from a study in the US that examined the health outcomes of hundreds of thousands of people living in cities across the US.10 The study found a relative risk of all-cause mortality of 1.06 per 10 µg/m3 change in PM2.5, and that this risk relationship was in the form of an exponential function. The exponential function has the format2:
y = Beβx Equation 1
x = concentration of PM2.5; y = incidence of all-cause mortality at PM2.5 concentration x; B = incidence at x = 0 (i.e. no PM2.5 exposure); eβx = relative risk (RR).
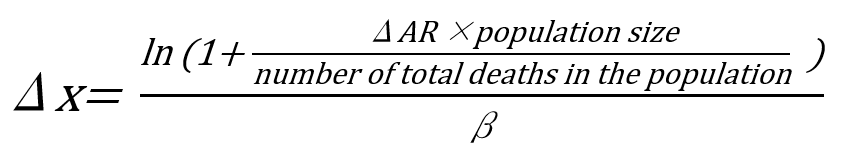
Rearranging this function will allow the calculation of a PM2.5 concentration for a given increase in risk of all-cause mortality. This rearrangement occurs as follows:
Firstly, we are examining the PM2.5 concentration change (Δx) from a change in absolute risk (ΔAR), that being 1 in 1 000 000, 1 in 100 000 or 1 in 10 000 increased mortality risk. This is examining the absolute risk between a population at the higher PM2.5 concentration (ARH) and subtracting the absolute risk from the same population without the PM2.5 concentration (ARL).
ΔAR = ARh – ARL Equation 2
Absolute risk (AR) = number of deaths divided by the population.
Now:
RR = ARH / ARL Equation 3
Using the above two equations and the previous definition of relative risk, the change in PM2.5 may be calculated by the following equation (click equation to expand):
Equation 4
β = 0.0058, back calculated from the Krewski et al study10 where the RR = 1.06 for a 10µg/m3 change in PM2.5.
A complicating factor is that the Krewski et al study10 was only conducted on those 30 years and older. Therefore, estimated population size and number of deaths in 2016 for those 30 years and older were obtained from the Australian Bureau of Statistics (ABS) for Australia and all states.11
Life days lost
Life days lost from the incremental risks (1 in 1 000 000, 1 in 100 000 and 1 in 10 000) were estimated using acquired ABS population and health data11 and the UK Office of National Statistics (ONS) life tables template (Chiang method (II)).12 This template was developed by the ONS to calculate life expectancy at birth. Life days lost were estimated by subtracting the estimated life expectancy of the population with the increased risk from the estimated life expectancy of the population with no excess risk. Life days lost for the 30–35 years age group were reported, as this age group statistically has the longest time to live among the cohort studied and therefore are estimated to lose the greatest number of life days.
Results
Table 1 shows the incremental increase in PM2.5 and the related life days lost that are associated with a 1 in 1 000 000, 1 in 100 000 and 1 in 10 000 risk of premature mortality. These values have been based on the Australian population as well as for each Australian state. For a 1 in 1 000 000 increased risk of premature mortality, a range of 0.01–0.02 µg/m3 increase in PM2.5 exposure was estimated to cause this effect, depending on location. This increased risk was associated with a maximum of half a day of life lost over a lifetime. For a 1 in 100 000 risk, a range of 0.13– 0.19 µg/m3 increase in PM2.5 exposure was estimated and associated with a maximum of 6 days of life lost over a lifetime. For a 1 in 10 000 risk, a range of 1.3–1.9 µg/m3 increase in PM2.5 exposure was estimated and associated with a maximum of 53–59 days of life lost over a lifetime.
Table 1. Relationship between incremental PM2.5 exposure, life days lost and increased risk of premature mortalitya
| Increased premature mortality risk | PM2.5 concentration (µg/m3)/days of life lost | ||||||
| Location | |||||||
| Australia | NSW | VIC | QLD | SA | WA | TAS | |
| 1 in 1 000 000 | 0.02/0.57 | 0.02/0.57 | 0.02/0.59 | 0.02/0.57 | 0.01/0.57 | 0.02/0.57 | 0.01/0.53 |
| 1 in 100 000 | 0.17/5.7 | 0.16/5.7 | 0.18/5.9 | 0.18/5.7 | 0.15/5.7 | 0.19/5.7 | 0.13/5.3 |
| 1 in 10 000 | 1.7/57 | 1.6/57 | 1.8/59 | 1.8/57 | 1.5/57 | 1.9/57 | 1.3/53 |
NSW = New South Wales; VIC = Victoria; QLD = Queensland; SA = South Australia; WA = Western Australia; TAS = Tasmania
a Increased premature mortality is based on an annualised mortality risk and life days lost is calculated over the remaining lifetime.
Discussion
Particle pollution is a key concern for many communities when certain major developments are proposed. This paper provides policy makers, planners and health consultants with a range of values to determine an appropriate level of incremental PM2.5 discharge from a development. The key to determining this is defining an ‘acceptable’ risk. The acceptability of risk extends beyond the realm of pure science and into societal risk tolerance, which may be dictated through societal norms, governing policies and personality traits. It requires consultation and agreement with key stakeholders including government, industry and the community. Therefore, this paper has calculated the annualised increase in premature mortality of 1 in 1 000 000, 1 in 100 000 and 1 in 10 000 in a population, based on increased annual exposure to PM2.5.
In relation to risk tolerance, four Australian documents provide guidance on this issue. In 2011, the NEPC produced their Methodology for setting air quality standards in Australia.13 In this document, the NEPC encourages a policy of ‘as low as reasonably possible’ while suggesting an upper limit of risk of no greater than 1 in 100 000. In 2017, NSW Health released its Public health response to prolonged smoke events5 where it classified the risk of mortality per event at: negligible (<1 in 1 000 000); low (1 in 1 000 000–1 in 100 000); moderate (1 in 100 000–1 in 10 000); high (>1 in 10 000), for an event being no greater than 3 months. In 2016, the NSW EPA Approved methods for the modelling and assessment of air pollutants in NSW defined an acceptable risk as less than 1 in 1 000 000; an unacceptable risk as greater than 1 in 10 000; and risks requiring implementation of best practice as 1 in 1 000 000–1 in 10 000. In 2011, the NSW Planning and Environment Risk criteria for land use safety planning defined an acceptable risk of 0.5–50 in 1 000 000, depending on land use.14 For context, these values can be compared with other defined premature mortality risks in our society.14-16
The concept of a 1 in 1 000 000 annualised increase risk in premature mortality is complex, and this paper has attempted to define what this means in terms of life days lost. The paper estimates that a maximum of between half a day to 60 days out of a whole lifetime, depending on the level of the risk, is lost due to the defined increased lifetime exposure to PM2.5. The word ‘maximum’ is used because this assumes that a person aged 30–35 years old is being exposed. The life years lost reduces with age such that a person aged 70–74 years old is estimated to lose between 1 hour and 5 days for the same exposures.
This paper has a number of limitations. The paper only uses 1 year of population data and may benefit from data averaged over a number of years. Nonetheless, there is good agreement across all regional values. The calculation of life days lost does not stratify by gender, to account for the differing life expectancies between the gender. This was not undertaken as the incremental PM2.5 was person and not gender based. Further, the study only considers all-cause mortality and as it is based on long-term (annual) exposure to PM2.5, it may not fully capture the impacts of short-term exposures to PM2.5. Also, the health endpoint only accounts for those aged 30 years and older. Children have been identified as susceptible to particulate matter exposure primarily around morbidity effects. In contrast, older adults are considered susceptible to particulate matter exposure for both morbidity and mortality effects, primarily owing to their declined physiological status.17 Therefore, while the effect of particulate matter on the younger population cannot be dismissed, in terms of annualised mortality risk, it is considered that the elderly are the more sensitive subgroup and potentially driving most of the risk. Finally, the suggested guideline does not account for background PM2.5 concentrations nor cumulative incremental impacts from multiple developments.
Conclusion
Many large-scale developments in Australia, such as major road projects, road tunnels or mines, produce particulate matter on an ongoing basis. The assessment of the incremental impacts of this particulate matter is paramount, yet is complicated by a lack of an agreed approach for its assessment. This paper develops criteria for the assessment of incremental impacts of long-term PM2.5 exposure. Although this paper allows the ability to determine acceptability of risk, in the absence of formal government policy we suggest that the Australian population results be adopted such that an annualised mortality risk below 1 in 1 000 000 is considered negligible, 1 in 1 000 000–1 in 100 000 risk is considered broadly acceptable, 1 in 100 000–1 in 10 000 risk is considered tolerable and greater than 1 in 10 000 risk is considered unacceptable. A grading scale of reasonable and feasible measures to reduce risks from the development classified as acceptable or tolerable could be adopted as shown in Table 2, with additional consideration of a maximum upper limit that accounts for background concentrations as currently defined in the NEPM.
Table 2. Suggested incremental assessment criterion for annual PM2.5 exposure
| Incremental annual average PM2.5 concentration (µg/m3) | Increased risk of mortality | Risk acceptability and suggested interpretation |
| 0–0.02 | <1 in 1 000 000 | Negligible |
| 0.02–0.17 | 1 in 1 000 000–1 in 100 000 | Acceptable
Development needs to show use of best practice with consideration of reasonable and feasible measures to reduce pollutant load |
| 0.17–1.7 | 1 in 100 000–1 in 10 000 | Tolerable
Only if best practice is proven and reasonable, and feasible measures have been demonstrated. At this level, costly interventions are now considered reasonable and feasible, that would not have been in the acceptable range |
| >1.7 | >1 in 10 000 | Unacceptable |
Peer review and provenance
Externally peer reviewed, not commissioned.

© 2019 Capon and Wright. This work is licensed under a Creative Commons Attribution-NonCommercial-ShareAlike 4.0 International Licence, which allows others to redistribute, adapt and share this work non-commercially provided they attribute the work and any adapted version of it is distributed under the same Creative Commons licence terms.
References
- 1. NSW Government: Health. Sydney: State of New South Wales NSW Ministry of Health. Particulate matter (PM10 and PM2.5); 2013 [cited 2019 Apr 8]. Available from: www.health.nsw.gov.au/environment/air/Pages/particulate-matter.aspx
- 2. US Environmental Protection Agency. Quantitative health risk assessment for particulate matter. US EPA, Office of Air and Radiation; 2010 [cited 2010 Nov 7]. Available from: www3.epa.gov/ttn/naaqs/standards/pm/data/PM_RA_FINAL_June_2010.pdf
- 3. World Health Organization. Review of evidence on health aspects of air pollution – REVIHAAP Project: technical report. Denmark: WHO, Regional Office for Europe; 2013 [cited 2019 Nov 7]. Available from: www.euro.who.int/__data/assets/pdf_file/0004/193108/REVIHAAP-Final-technical-report.pdf
- 4. Australian Government: federal register of legislation. Canberra: Australian Department of Environment. National environment protection (ambient air quality) measure; 2016 [cited 2019 Apr 8]. Available from: www.legislation.gov.au/Details/F2016C00215
- 5. Office of the Chief Health Officer. Public health response to prolonged smoke events. Sydney: NSW Health; 2017 [cited 2019 Nov 7]. Available from: www1.health.nsw.gov.au/pds/ActivePDSDocuments/GL2017_011.pdf
- 6. Environment Protection Authority Victoria, Department of Health and Human Services and Emergency Management Victoria. Community smoke, air quality and health standard – air quality assessment, forecasting and health protection messaging for particulate matter. Melbourne: Victorian Government; 2015.
- 7. NSW Environment Protection Authority. Approved methods for modelling and assessment of air pollutants in New South Wales. Sydney: State of NSW and Environment Protection Authority; 2017 [cited 2019 Nov 7]. Available from: https://www.epa.nsw.gov.au/publications/air/approved-methods-modelling-assessment-air-pollutants-160666
- 8. Committee on the Medical Effects of Air Pollutants. The mortality effects of long-term exposure to particulate air pollution in the United Kingdom. Health Protection Agency; 2010 [cited 2019 Nov 7]. assets.publishing.service.gov.uk/government/uploads/system/uploads/attachment_data/file/304641/COMEAP_mortality_effects_of_long_term_exposure.pdf
- 9. Jalaudin B, Cowie C. Health risk assessment – preliminary work to identify concentration-response functions for selected ambient air pollutants. Sydney: Woolcock Institute of Medical Research; 2012 [cited 2019 Nov 7]. Available from: www.nepc.gov.au/system/files/pages/18ae5913-2e17-4746-a5d6-ffa972cf4fdb/files/health-report.pdf
- 10. Krewski D, Jerrett M, Burnett RT, Ma R, Hughes E, Shi Y, et al. Extended follow-up and spatial analysis of the American Cancer Society study linking particulate air pollution and mortality. Res Rep Health Eff Inst. 2009(140):5–114; discussion 5–36. PubMed
- 11. Australian Bureau of Statistics. Deaths, year of registration, age at death, age-specifc death rates, sex, states, territories and Australia. Canberra: ABS; 2018 [cited 2019 Apr 8]. Available from: stat.data.abs.gov.au/Index.aspx?DatasetCode=DEATHS_AGESPECIFIC_REGISTRATIONYEAR
- 12. Office for National Statistics. Life table templates. London: Office for National Statistics; 2011 [cited 2019 Apr 8]. Available from: webarchive.nationalarchives.gov.uk/20110824183840/https://www.statistics.gov.uk/statbase/ssdataset.asp?vlnk=6949
- 13. National Environment Protection Council. Methodology for setting air quailty standards in Australia: part A. Canberra: Commonwealth of Australia; 2011 [cited 2019 Nov 7]. Available from: www.nepc.gov.au/system/files/resources/458719dc-73eb-4cfd-a688-a36b32e80f6c/files/methodology-air-quality-standards-australia-parta.pdf
- 14. NSW Planning. Hazardous industry planning advisory paper No 4: risk criteria for land use safety planning. Sydney: State of New South Wales; 2011 [cited 2019 Apr 8]. Available from: www.planning.nsw.gov.au/-/media/Files/DPE/Other/hazardous-industry-planning-advisory-paper-no-4-risk-criteria-for-land-use-safety-planning-2011-01.pdf?la=en
- 15. Higson DJ. Risks to individuals in NSW and in Australia as a whole. Sydney: Australian Nuclear Science and Technology Organisation, Nuclear Safety Bureau; 1989 [cited 2019 Apr 8]. Available from: apo.ansto.gov.au/dspace/handle/10238/1188
- 16. Dinman BD. The reality and acceptance of risk. JAMA. 1980;244(11):1226–8. CrossRef | PubMed
- 17. Sacks JD, Stanek LW, Luben TJ, Johns DO, Buckley BJ, Brown JS, et al. Particulate matter-induced health effects: who is susceptible? Environ Health Perspect. 2011;119(4):446–54. CrossRef | PubMed